The Main Cost Levers in Climate-Neutral Scenarios
First Posted: 2026.10.26, Revision History, Author: Tom Brown
What are the biggest levers for reducing costs in climate-neutral scenarios? Electrification, technological learning, biomass, CO2 sequestration, grid expansion, demand changes.
In our May 2026 paper A Minimal Methanol Backstop (blog post, FAQ) we did sixteen sensitivity runs on a climate-neutral model for Europe. Changing the model assumptions shows how the total annualised system costs react. The first bar shows the absolute costs in the default scenario, with subsequent bars showing only differences. The size of each effect depends on the assumptions tested, and the percentage changes cannot simply be added together. It is of course just a model, not reality, but at least it's open source, so you're free to look inside and improve it.
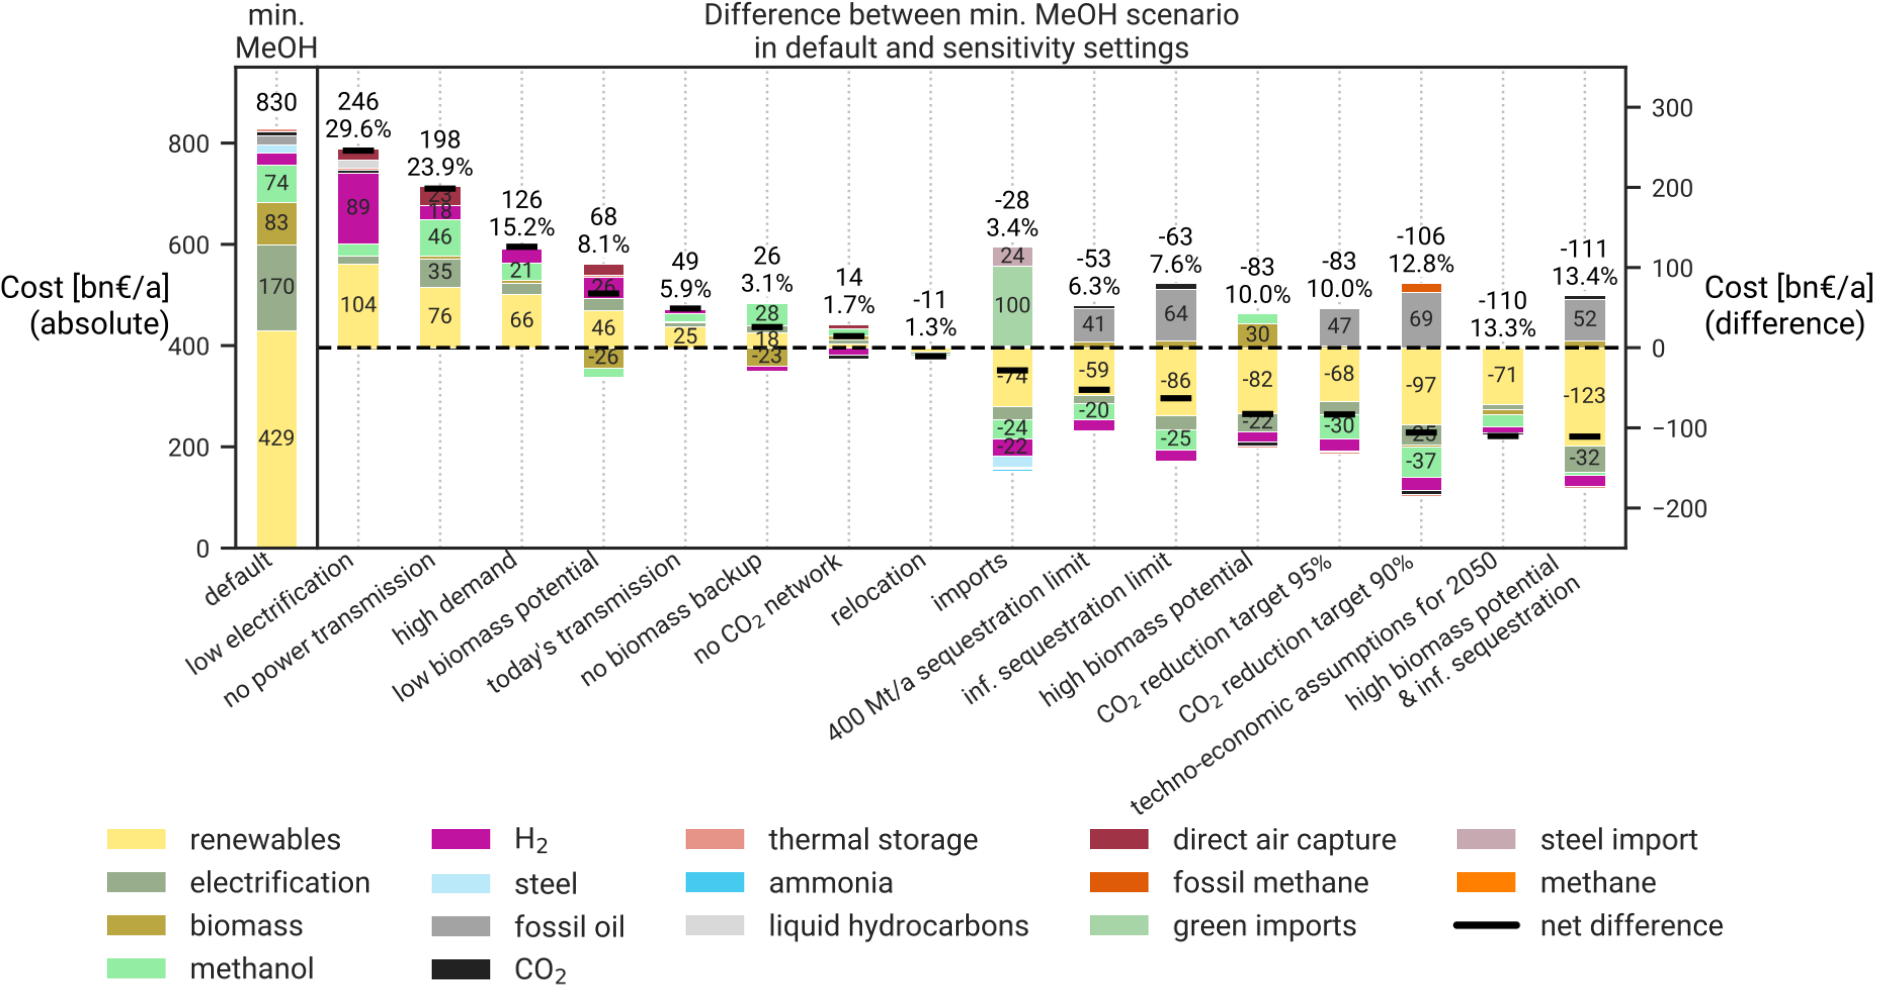
Figure 1: Total annual system costs, with investments annualised, for the default minimal methanol scenario (first bar on left) and differences to the default (other bars), with net changes as a black line (Source: based on Figure 9 from Glaum et al, 2026)
Electrification: The premise of the methanol backstop was that high electrification helps to minimise the leftover sectors that need chemical fuel. If important sectors do not electrify as we assumed, then costs rise by 30% since the model is forced to use synthetic fuels in those sectors. Those sectors were high- and medium-temperature industry heat, domestic navigation, domestic aviation, as well as heavy-duty land transport. Note that the costs of the charging infrastructure and the electric vehicles themselves were not included in the calculation.
Technological learning: Europe aims to achieve net-zero greenhouse gas emissions by 2050. Since most investments have to take place before then, and to avoid projecting too far into an uncertain future, we used cost assumptions for 2030. Most of the assumptions come from the Danish Energy Agency. If we use costs projected for 2050 instead, by which time technologies like solar and batteries have a further 20 years to reduce in cost thanks to improved manufacturing, then total costs drop by 13.3%.
Biomass potentials: We only allow the model to use biomass sources that don't cause additional land use, such as agricultural residues from food production like straw, forestry residues from wood harvesting, or biogenic waste. Dedicated energy crops are excluded. Our default case uses the "medium" assumptions from the European Commission's Joint Research Centre's ENSPRESO dataset, around 1550 TWh/a. Switching to the "high" potential of 3320 TWh/a reduces costs by 10% since the model uses biomethanol to replace all the e-methanol produced with captured CO2. On the other hand, the "low" potential of 840 TWh/a raises costs by 8.1% as the model is forced to use direct air capture to source CO2 for e-methanol instead of using biogenic carbon.
CO2 sequestration: The default assumption in the model limits Europe-wide CO2 sequestration to 200 MtCO2/a. Sequestration in Europe is currently in the low single digits, but the EU's Net Zero Industry Act has a target of 50 MtCO2/a injection capacity by 2030, with projected storage needs of around 250 MtCO2/a by 2040 (European Commission, 2026). It is often said that storing CO2 underground should be cheaper than using it in e-fuels. On the other hand, adding electrolytic hydrogen to biogenic syngas with excess CO to produce e-biofuels can avoid some of the thermodynamic work of using raw CO2 (Zhang et al, 2026), and it's not clear that we can scale up all the CO2 sequestration and pipeline infrastructure fast enough to compensate all hard-to-abate fossil CO2 emissions. To explore the trade-offs, we raised the sequestration limit to 400 MtCO2/a and then unlimited, where around 500 MtCO2/a is sequestered. This reduces costs by 6.3% and 7.6% respectively, by allowing biogenic carbon dioxide removal (sequestering biogenic CO2) to offset emissions from increased fossil-fuel use in aviation, shipping and the chemical industry, and thus lowering expensive electrolytic hydrogen production. If we simultaneously increase biomass potentials with unlimited sequestration, costs drop by 13.4% and the marginal abatement cost goes below 100 €/tCO2 (453 MtCO2/a is sequestered in this scenario).
Grid expansion: In the default scenario the model can choose the optimal electricity transmission corridors to reinforce, up to a total increase of the grid by 25% measured in MWkm. If we force the model to use today's grid, costs rise by 5.9%, since the grid can no longer balance wind fluctuations over long distances as effectively, and has to produce more backup fuels to be used locally. A thought experiment that removes power transmission altogether raises costs by 24%, showing the cost of foregoing electricity exchange between model regions.
Relocation and imports of green products: Allowing green steel and ammonia production to move from their current locations to the best renewable sites in Europe lowers costs by 1.3%. Allowing imports of green methanol, steel and ammonia from outside Europe reduces costs by 3.4%.
Demand: More obviously, changes to overall demand also have a big effect. Raising demand for road transport, aviation, shipping and high-value chemicals by 30% increases total costs by 15%. Sufficiency, i.e. choosing to consume less, has the opposite effect. Energy efficiency improvements can also reduce system costs, although these savings must be weighed against the investment needed to achieve them.
Table of Contents
1. Methanol versus hydrogen/methane scenarios
Our research paper (Glaum et al, 2026) explored using methanol as a substitute for hydrogen and methane in backup electricity and heat applications, thus removing the need for gaseous fuel networks. In the "all networks scenario", both hydrogen and methane networks are allowed. The original Figure 9 shows the differences between the "minimal methanol backstop" and the "all networks" scenario for each sensitivity in Panel A.
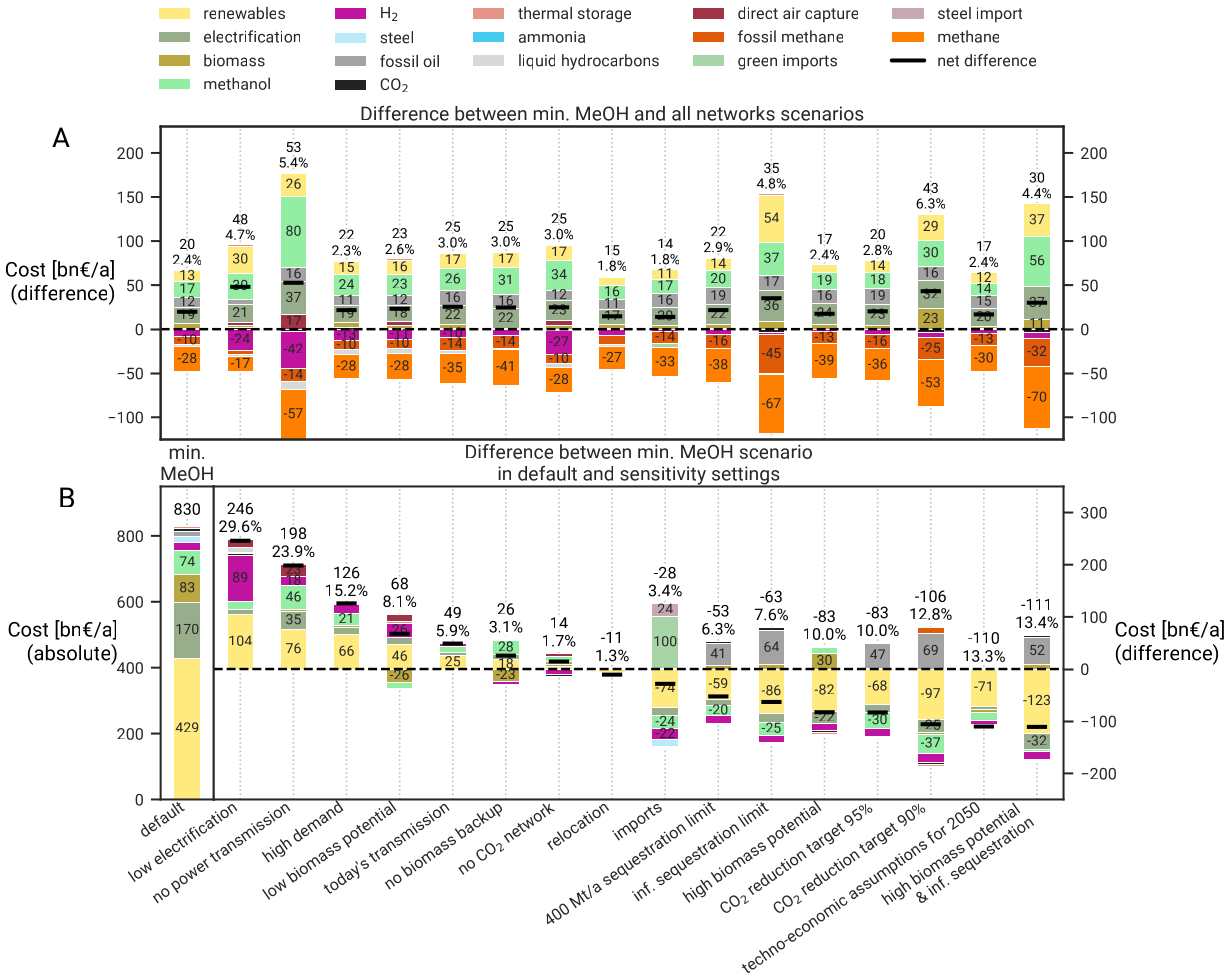
Figure 2: Minimal methanol backstop sensitivities, including difference to "all networks" in Panel A (Source: Glaum et al, 2026)
The cost premium for the minimal methanol backstop remains mostly in a fairly narrow 2-3% range, showing that the use of the minimal methanol backstop is not that important for the sensitivity analysis. Several sensitivities show larger differences, including "low electrification", "no power transmission" and "infinite sequestration".
2. Energy balances
The energy balances for hydrogen, methane, methanol and liquid hydrocarbons are shown for all sensitivities in the Supplemental Information section of the paper.
Here is a selection charting the increase in the sequestration limit. As sequestration increases, production of electrolytic hydrogen and e-methanol decreases, while fossil oil use grows.
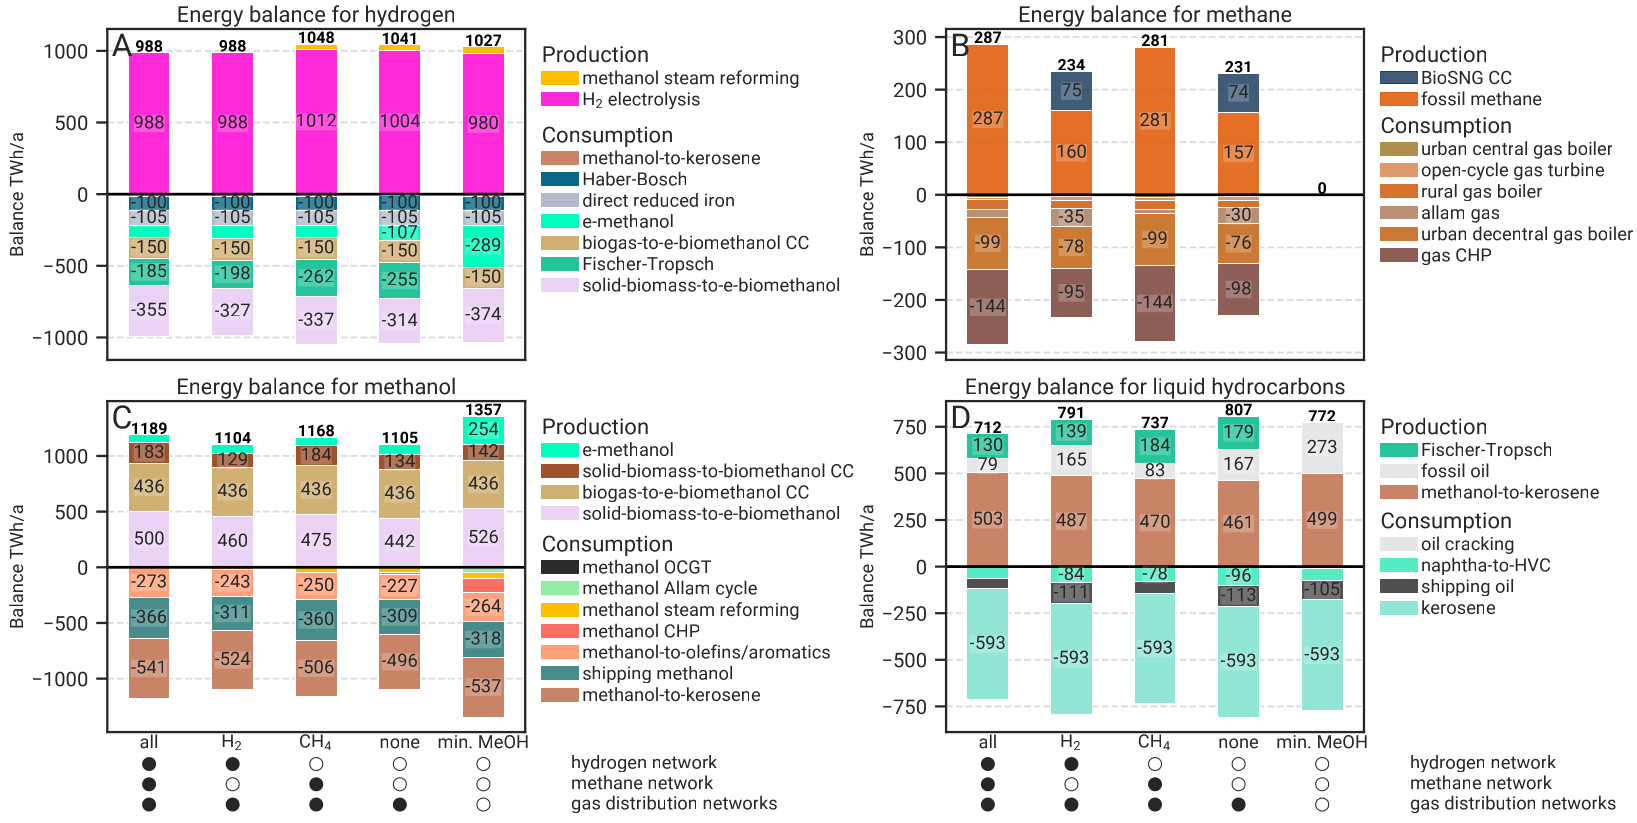
Figure 3: Energy balances for the default scenario with 200 MtCO2/a sequestration. (Source: Glaum et al, 2026)
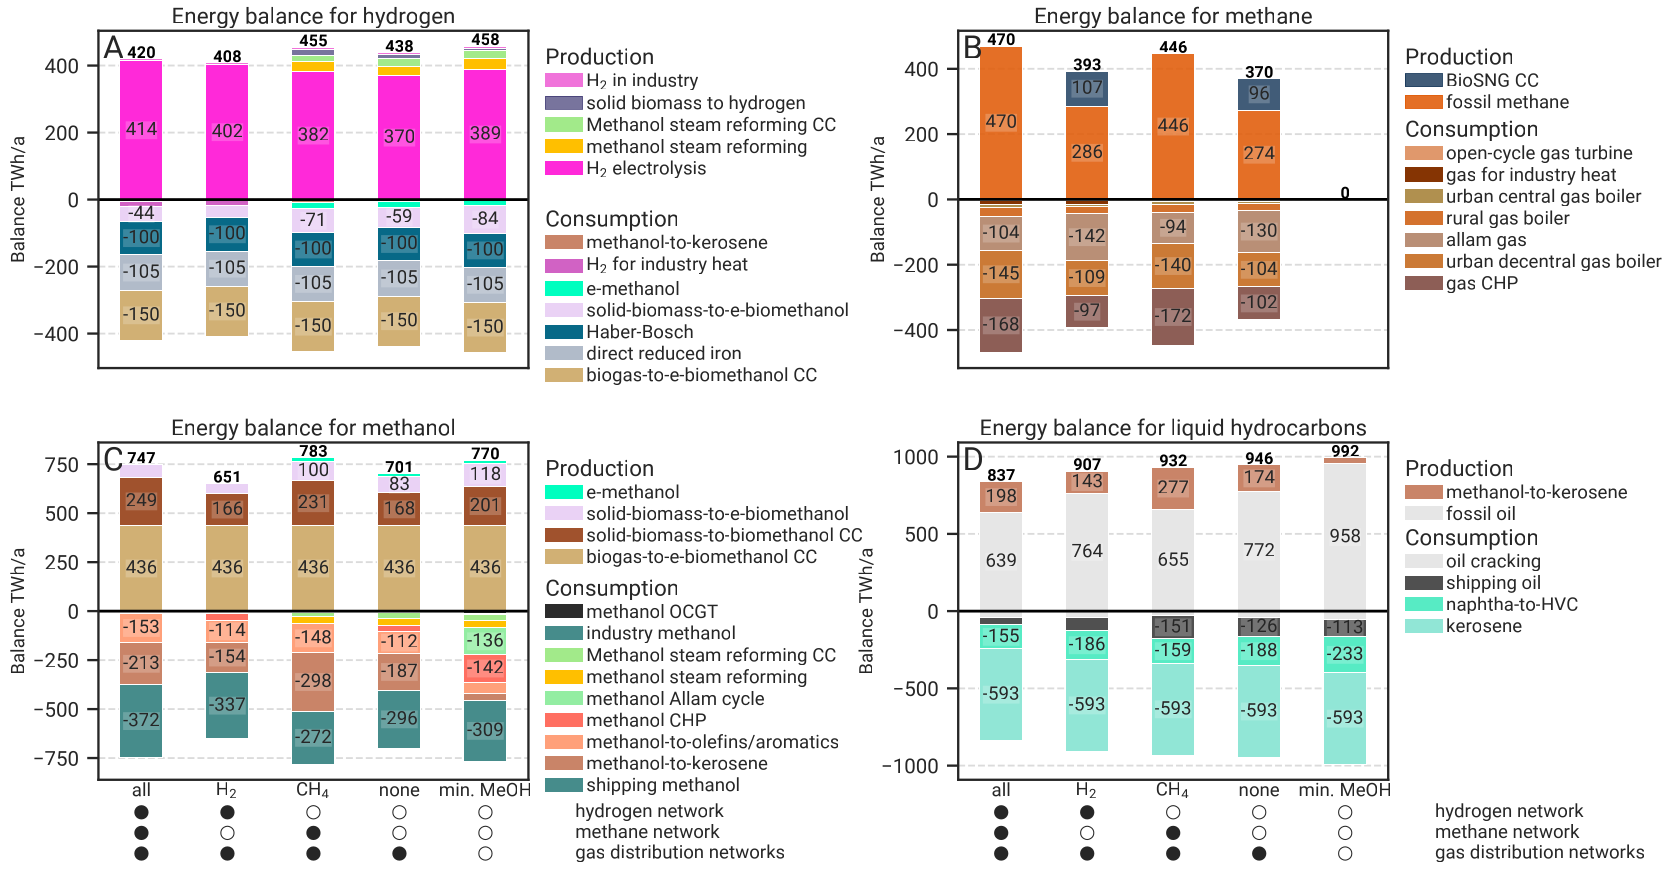
Figure 4: Energy balances for sensitivity with 400 MtCO2/a sequestration. (Source: Glaum et al, 2026)
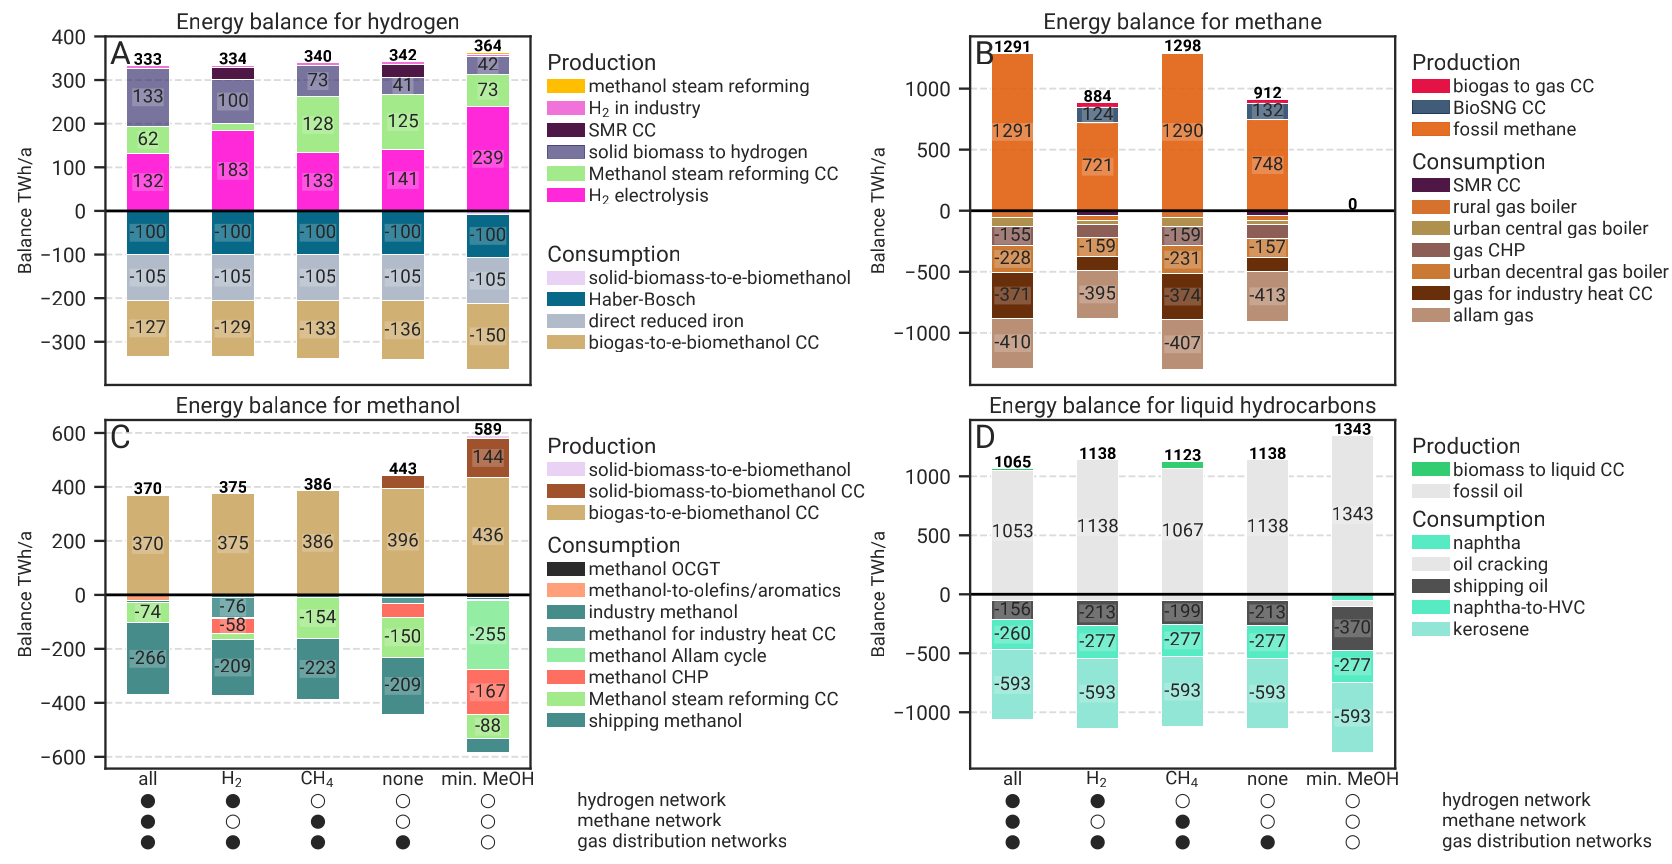
Figure 5: Energy balances for sensitivity with no upper limit on sequestration. (Source: Glaum et al, 2026)
3. Marginal carbon dioxide abatement costs
The marginal CO2 abatement cost measures the cost of tightening the emissions constraint by another tonne. It is not an average cost of decarbonisation or a prediction of the ETS price.
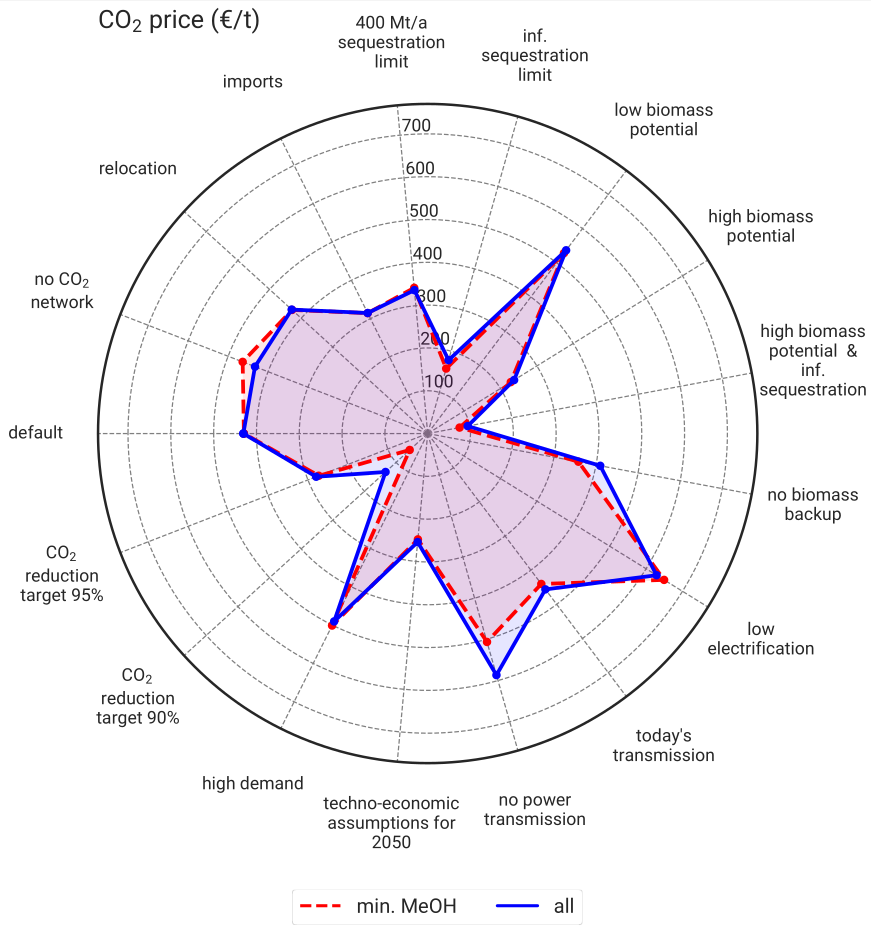
Figure 6: CO2 marginal abatement cost (shadow price of CO2 limit) for the all networks and the minimal methanol backstop scenarios across the different sensitivity settings. (Source: Glaum et al, 2026)