Solar and batteries can power the world
First Posted: 2026.02.09, Last Revised: 2026.03.30, Author: Tom Brown
Energy Transition Show podcast
Solar and batteries are cheap enough that most people can get most of their electricity from them, and save money. This equation gets better and better over time as their costs decline.
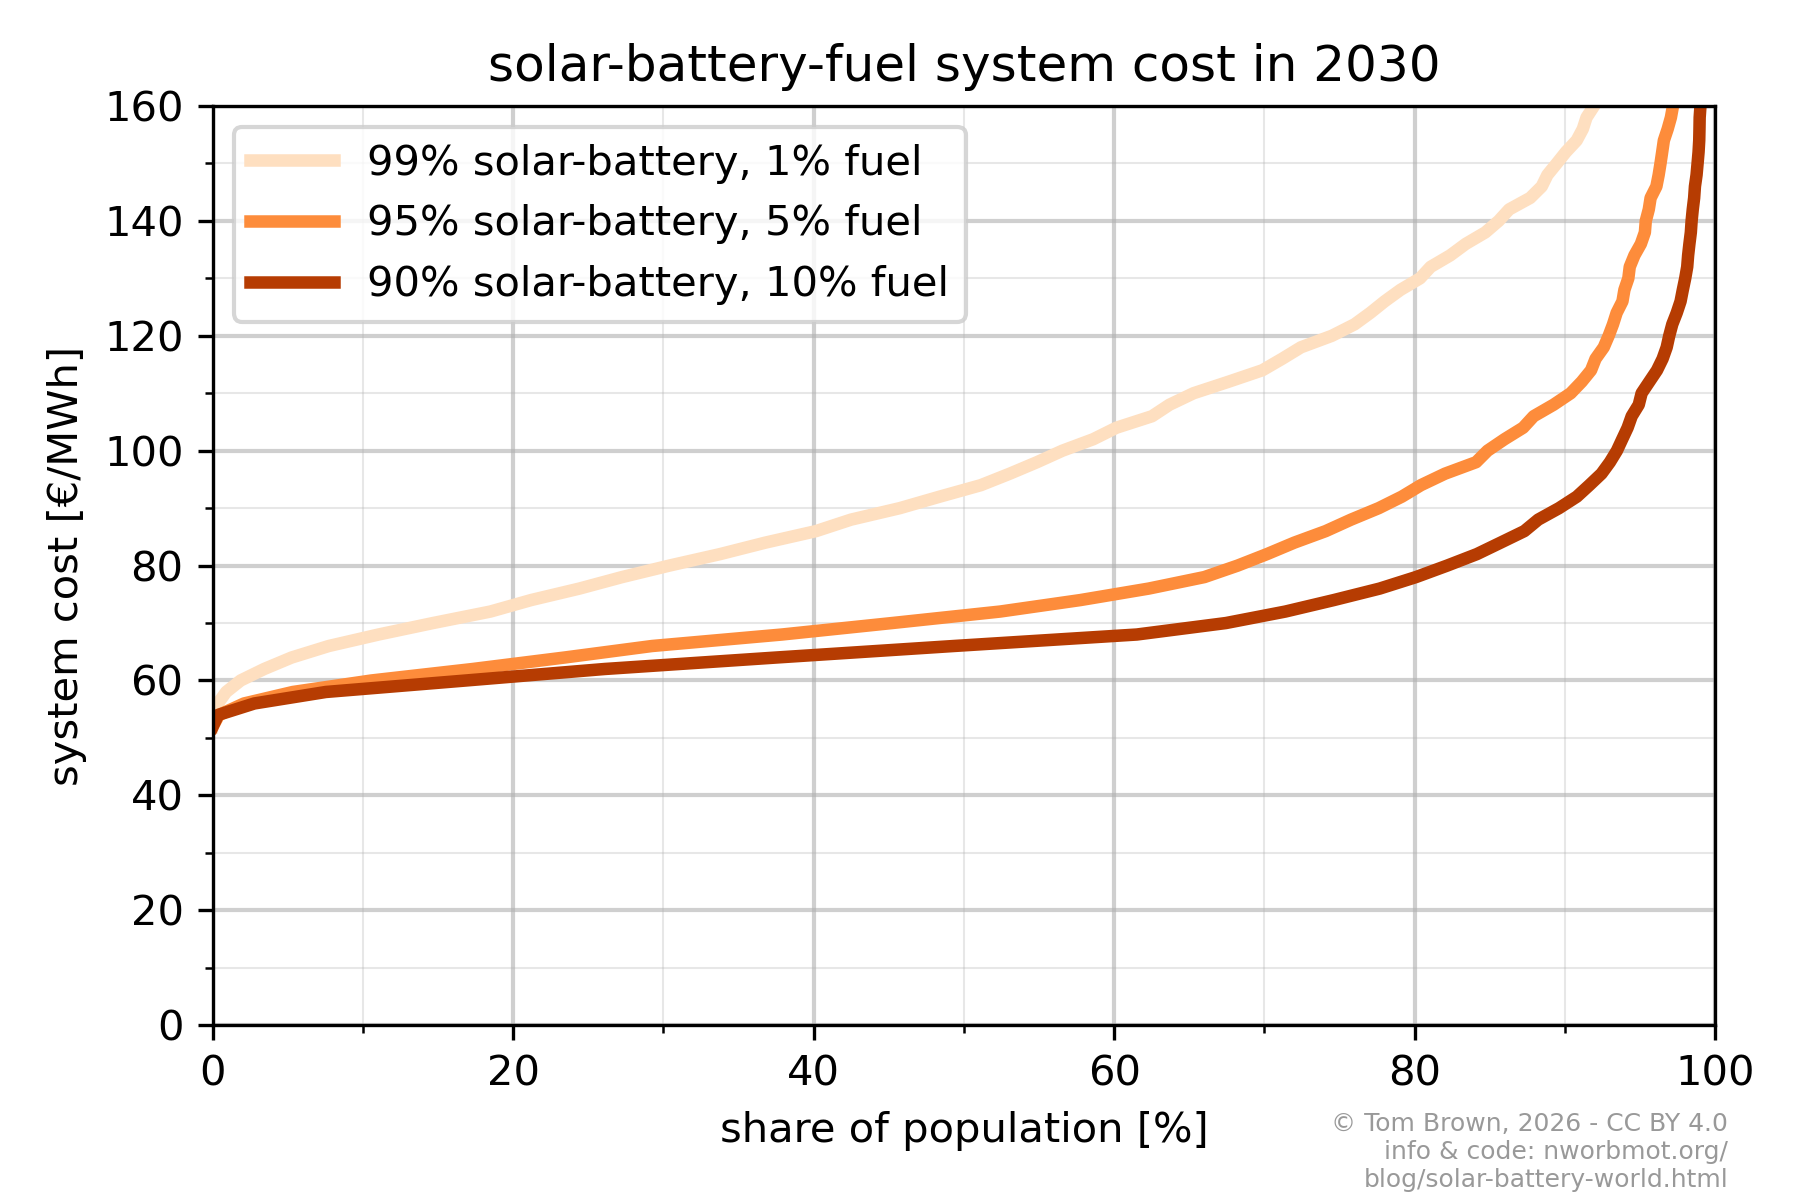
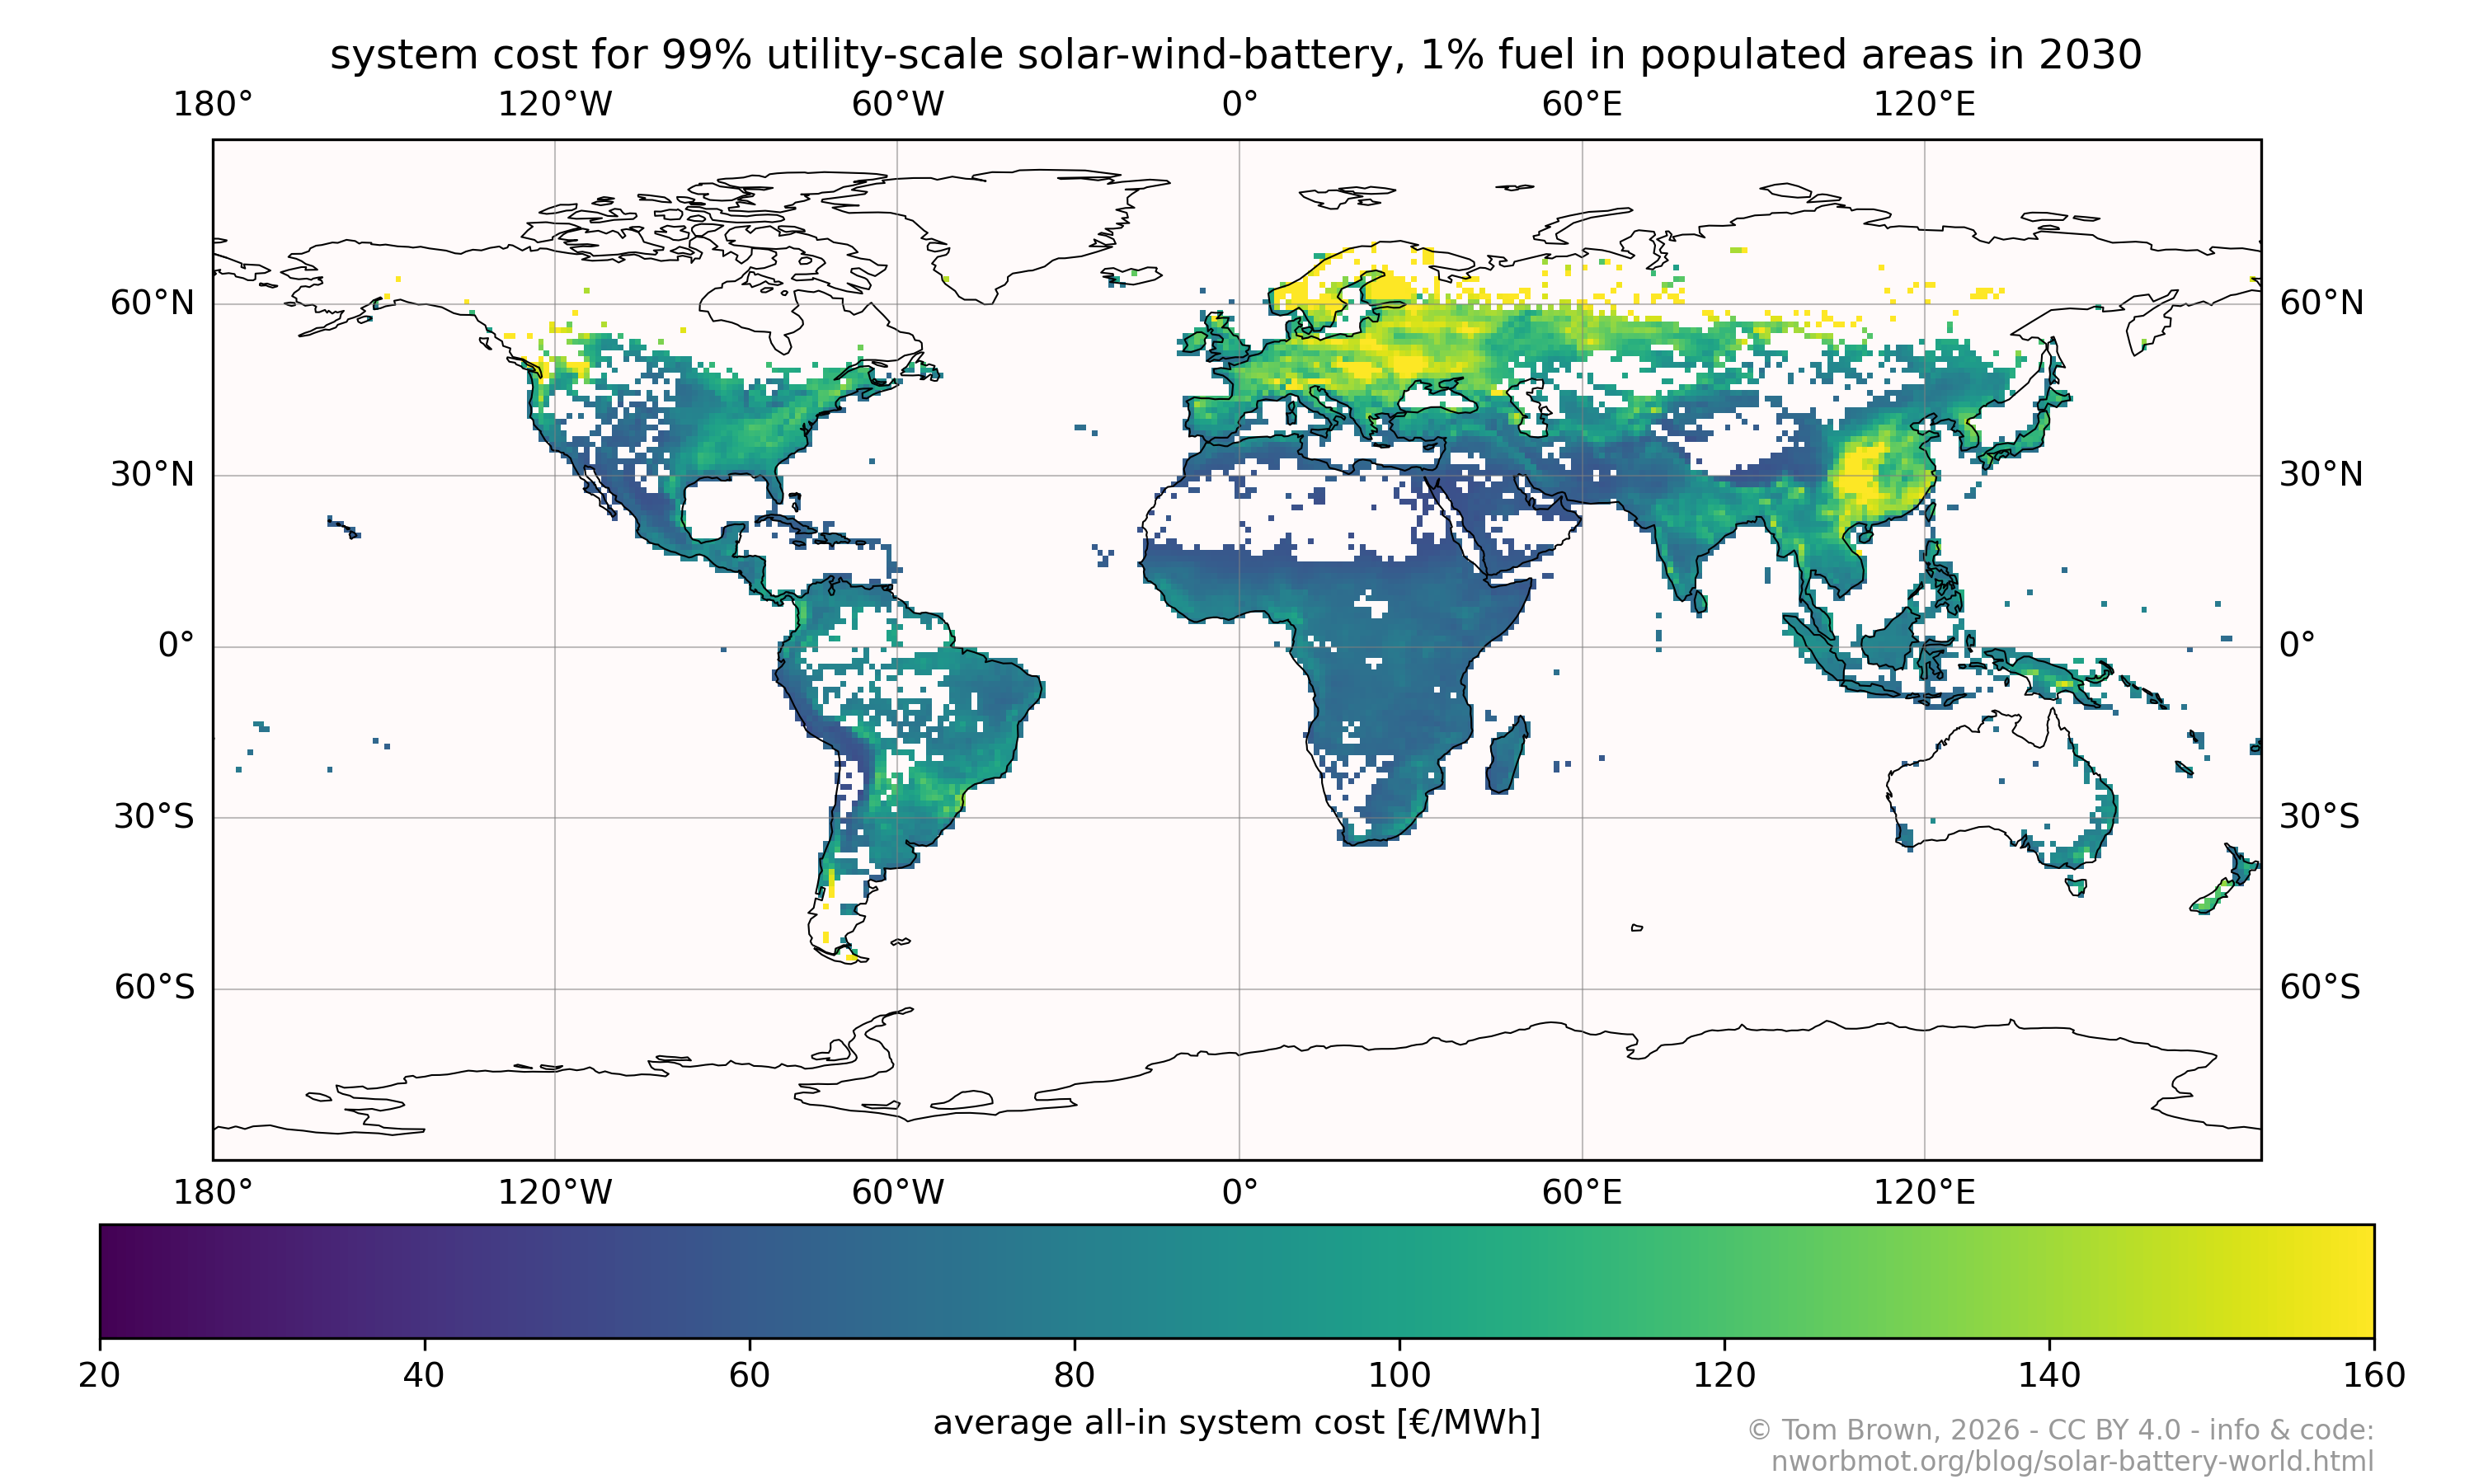
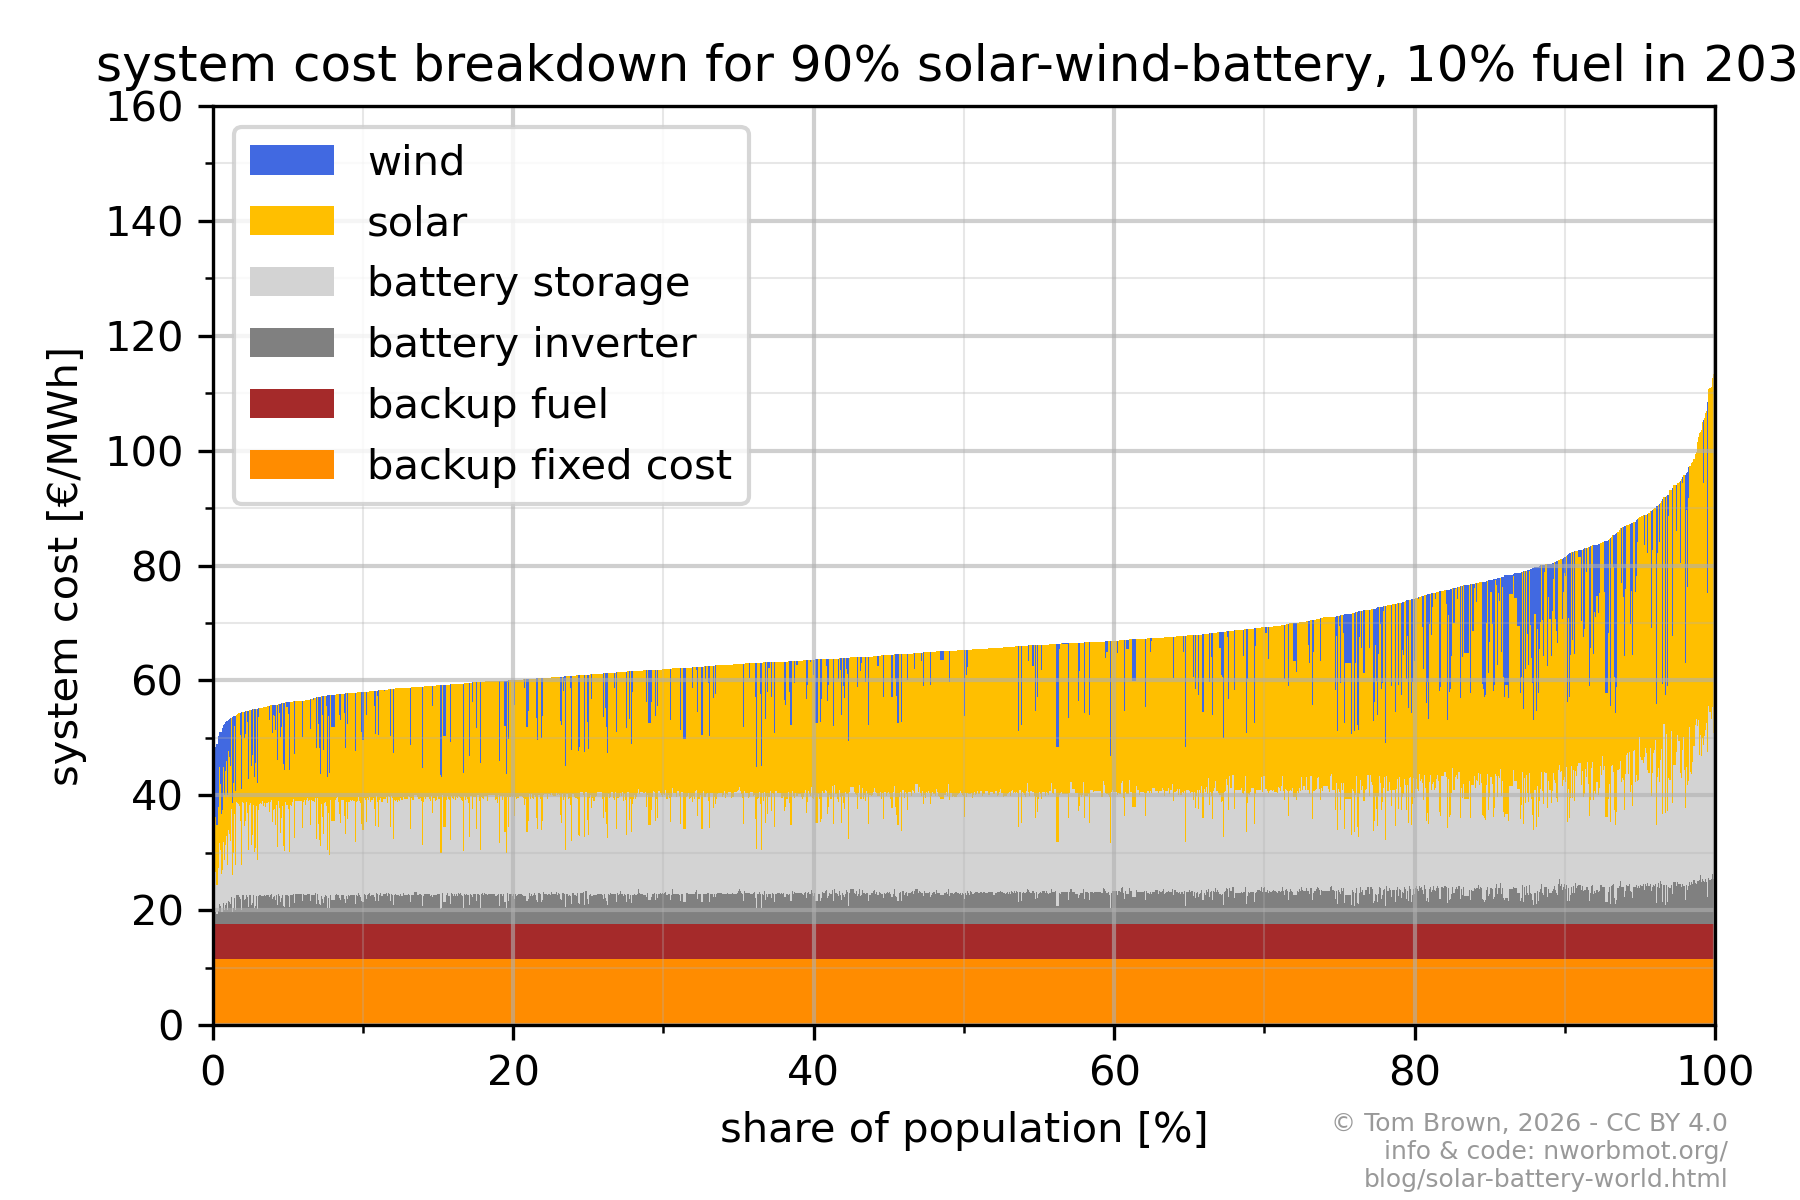
More precisely: solar and batteries can supply 90% of electricity for 80% of the world's population at less than 80 €/MWh (including a fuel backup) with 2030 assumptions. Add some wind, existing hydro, or wait a few more years for costs to decline, and the equation just gets better.
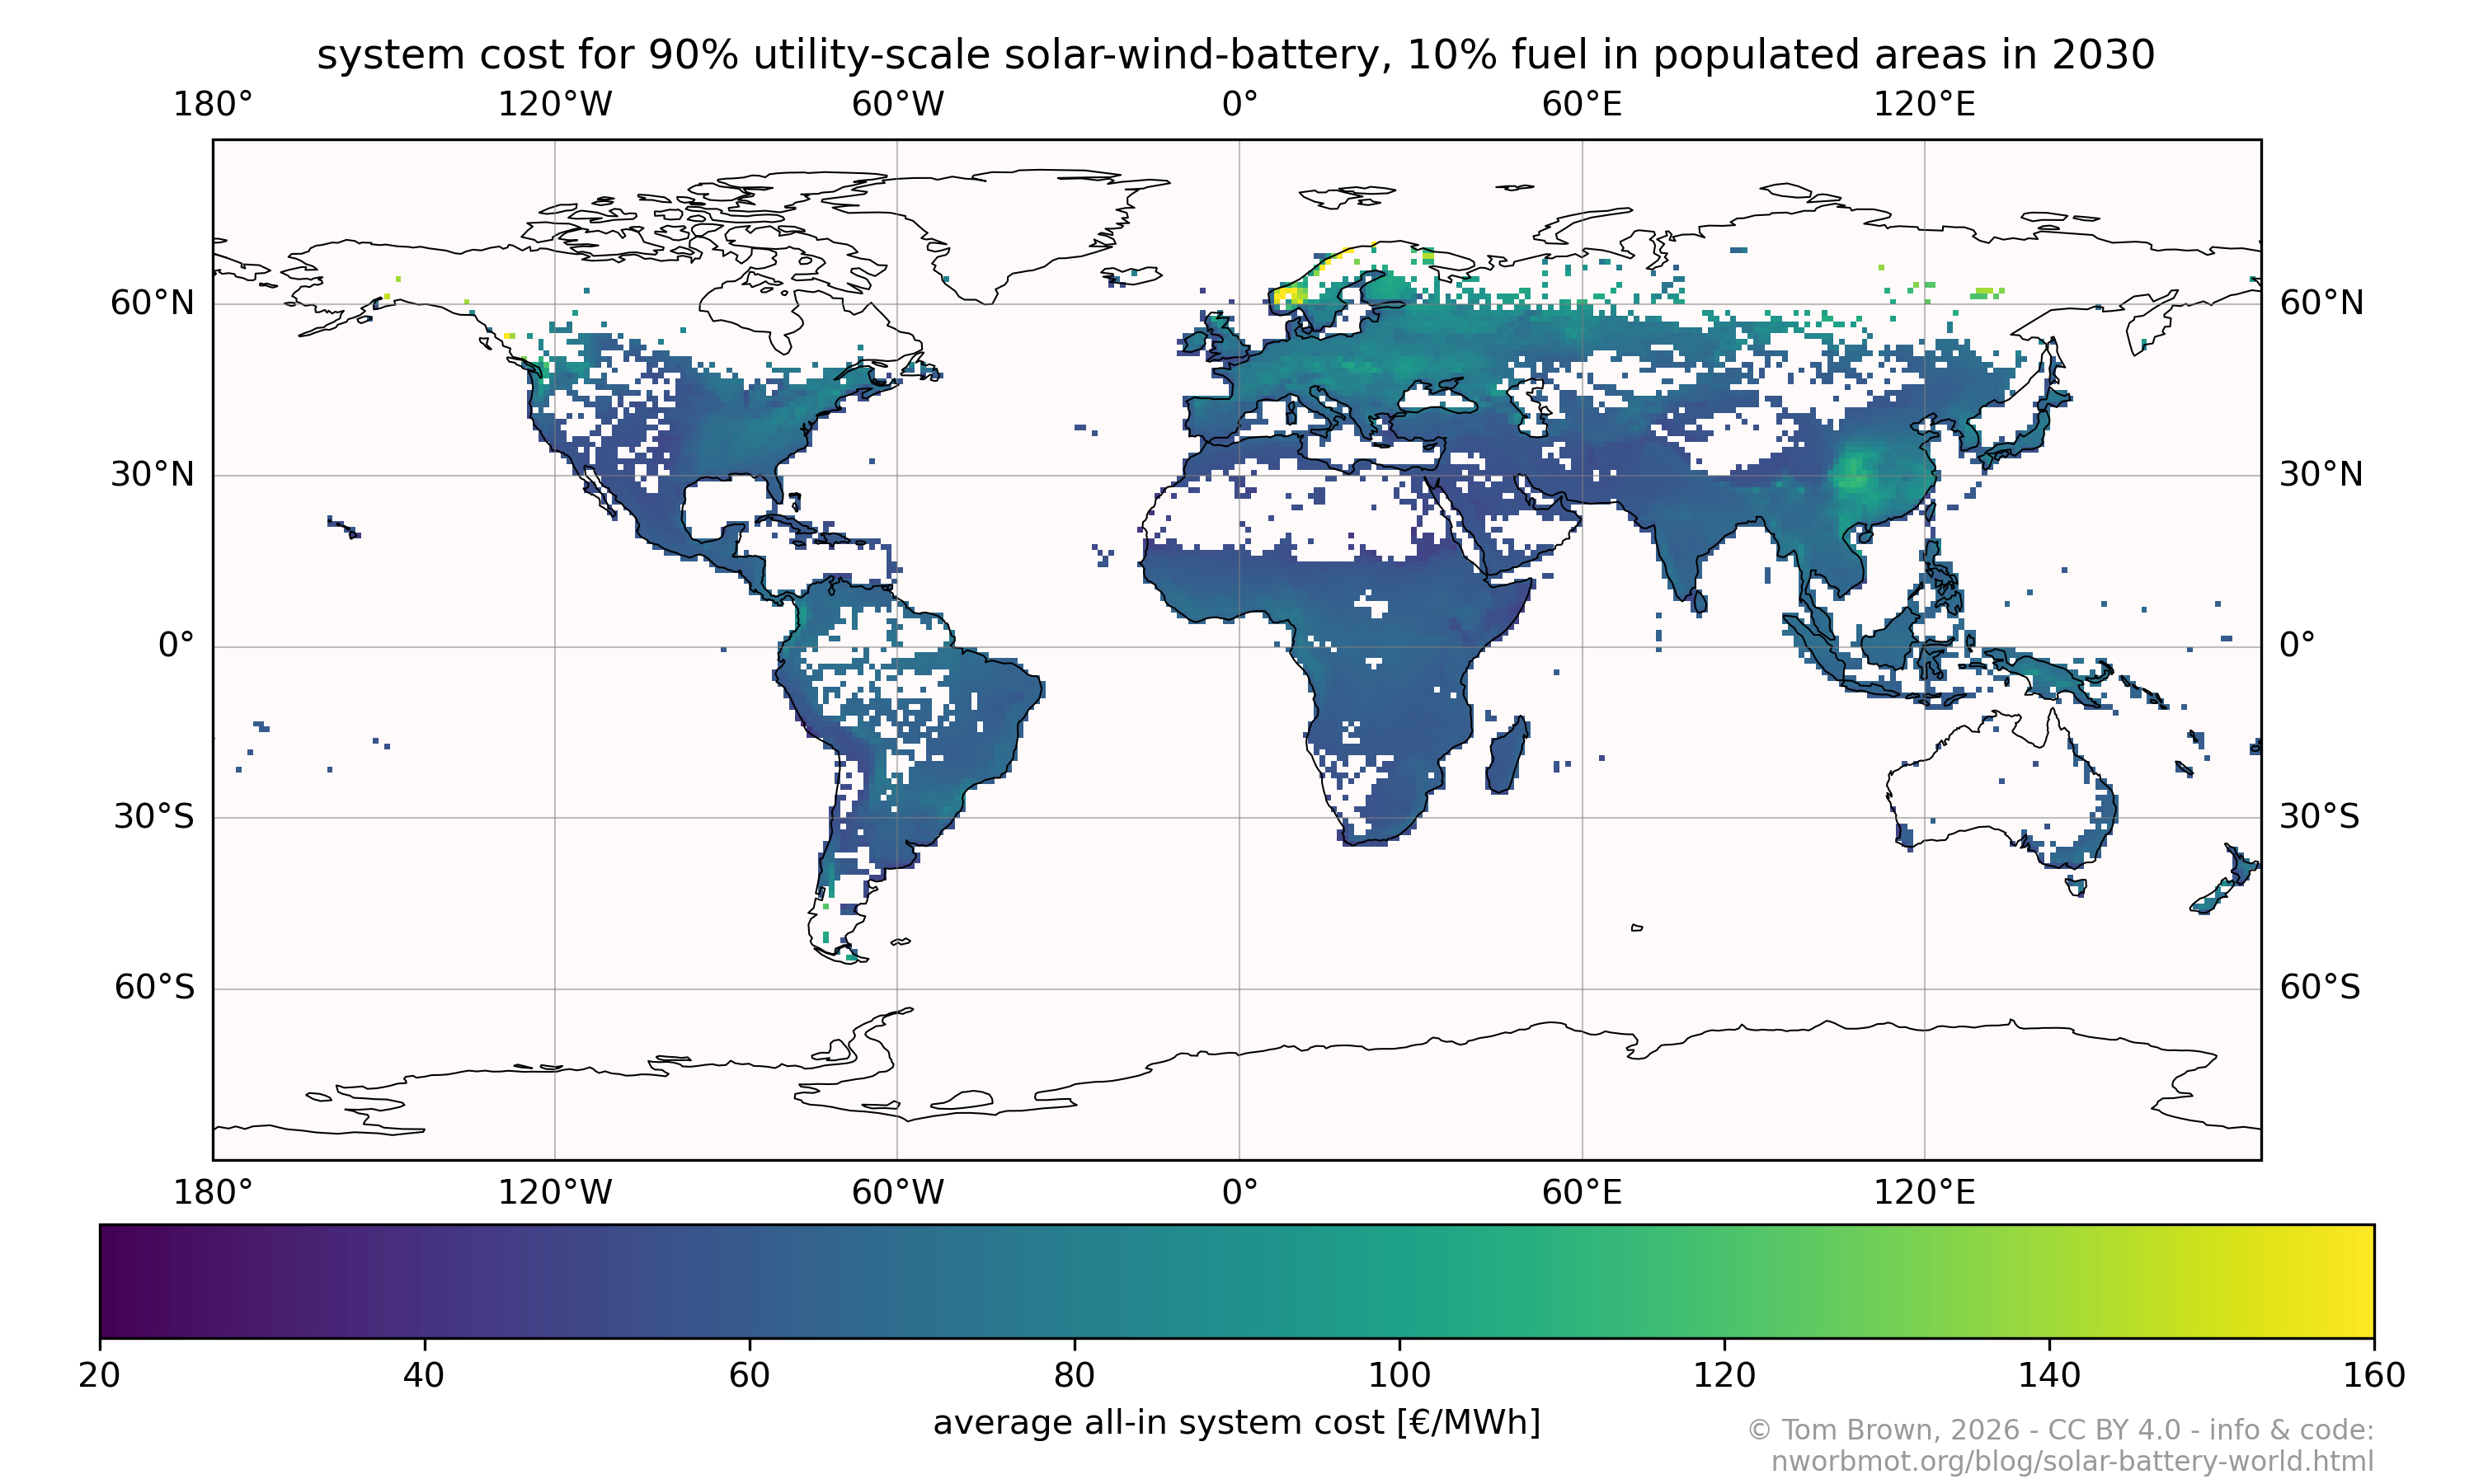
The map shows the total average system cost of providing electricity for a constant hourly demand in 2030 with solar and batteries providing 90% of the electricity and some storeable fuel the final 10%.
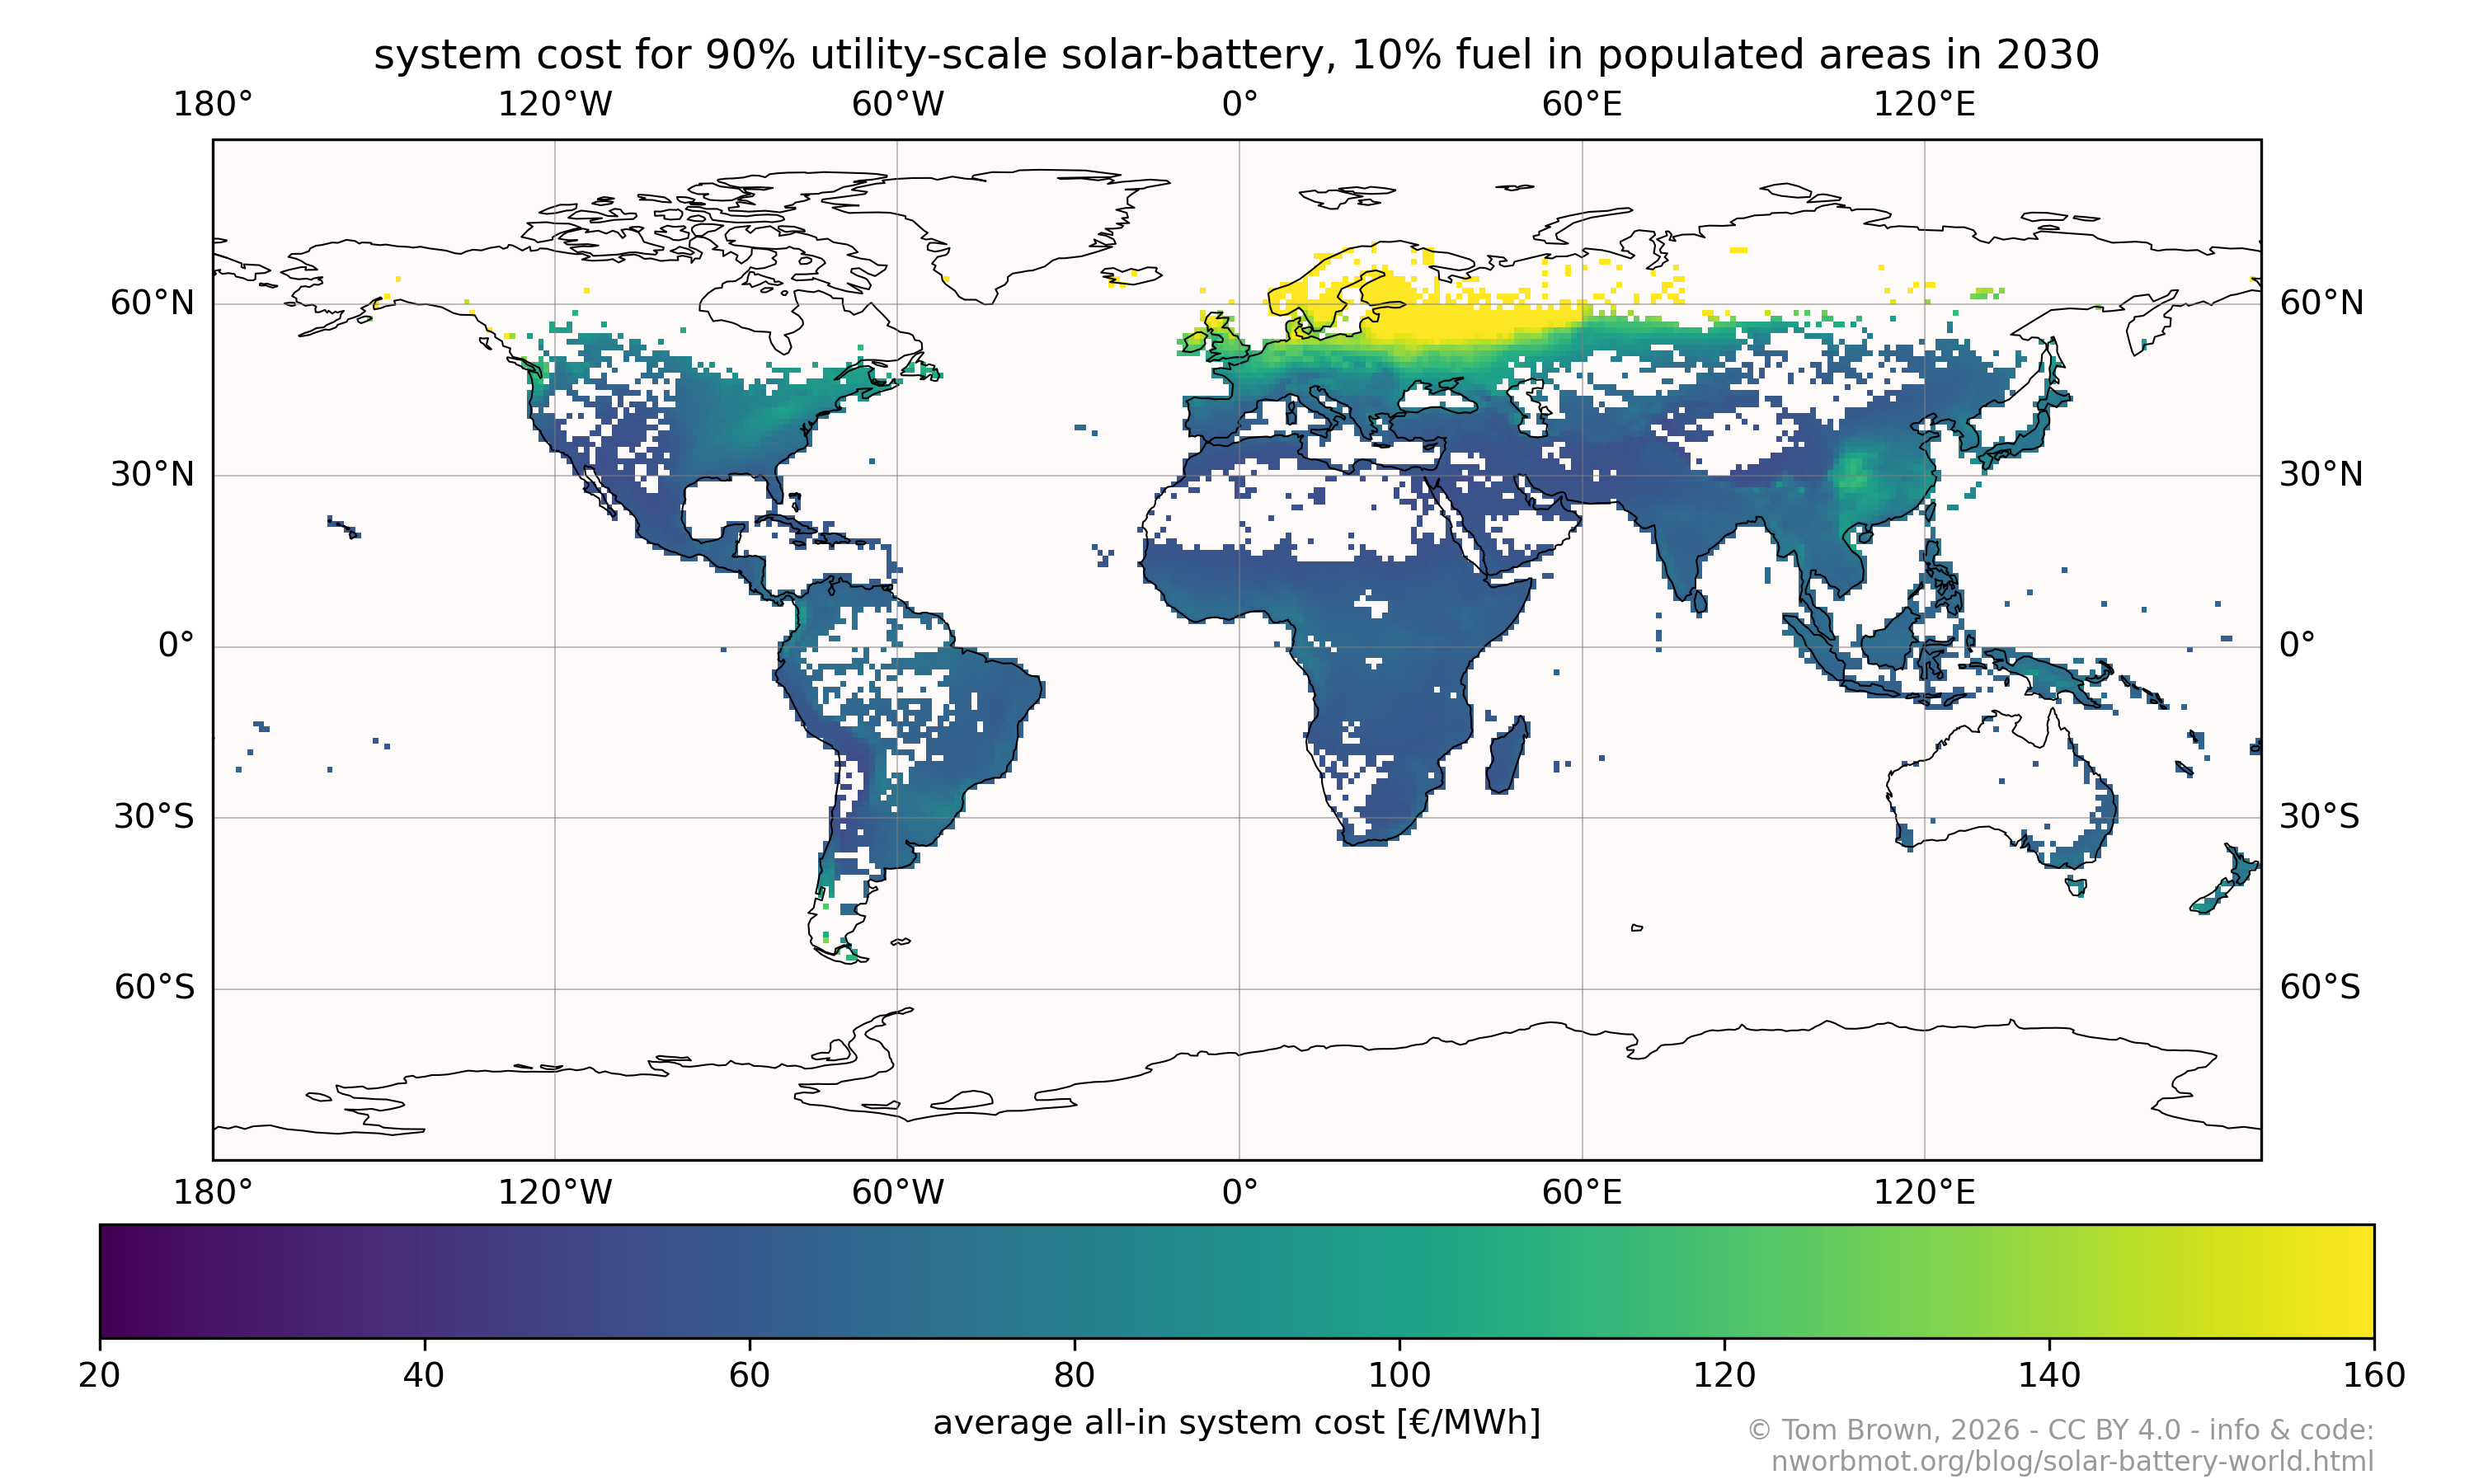
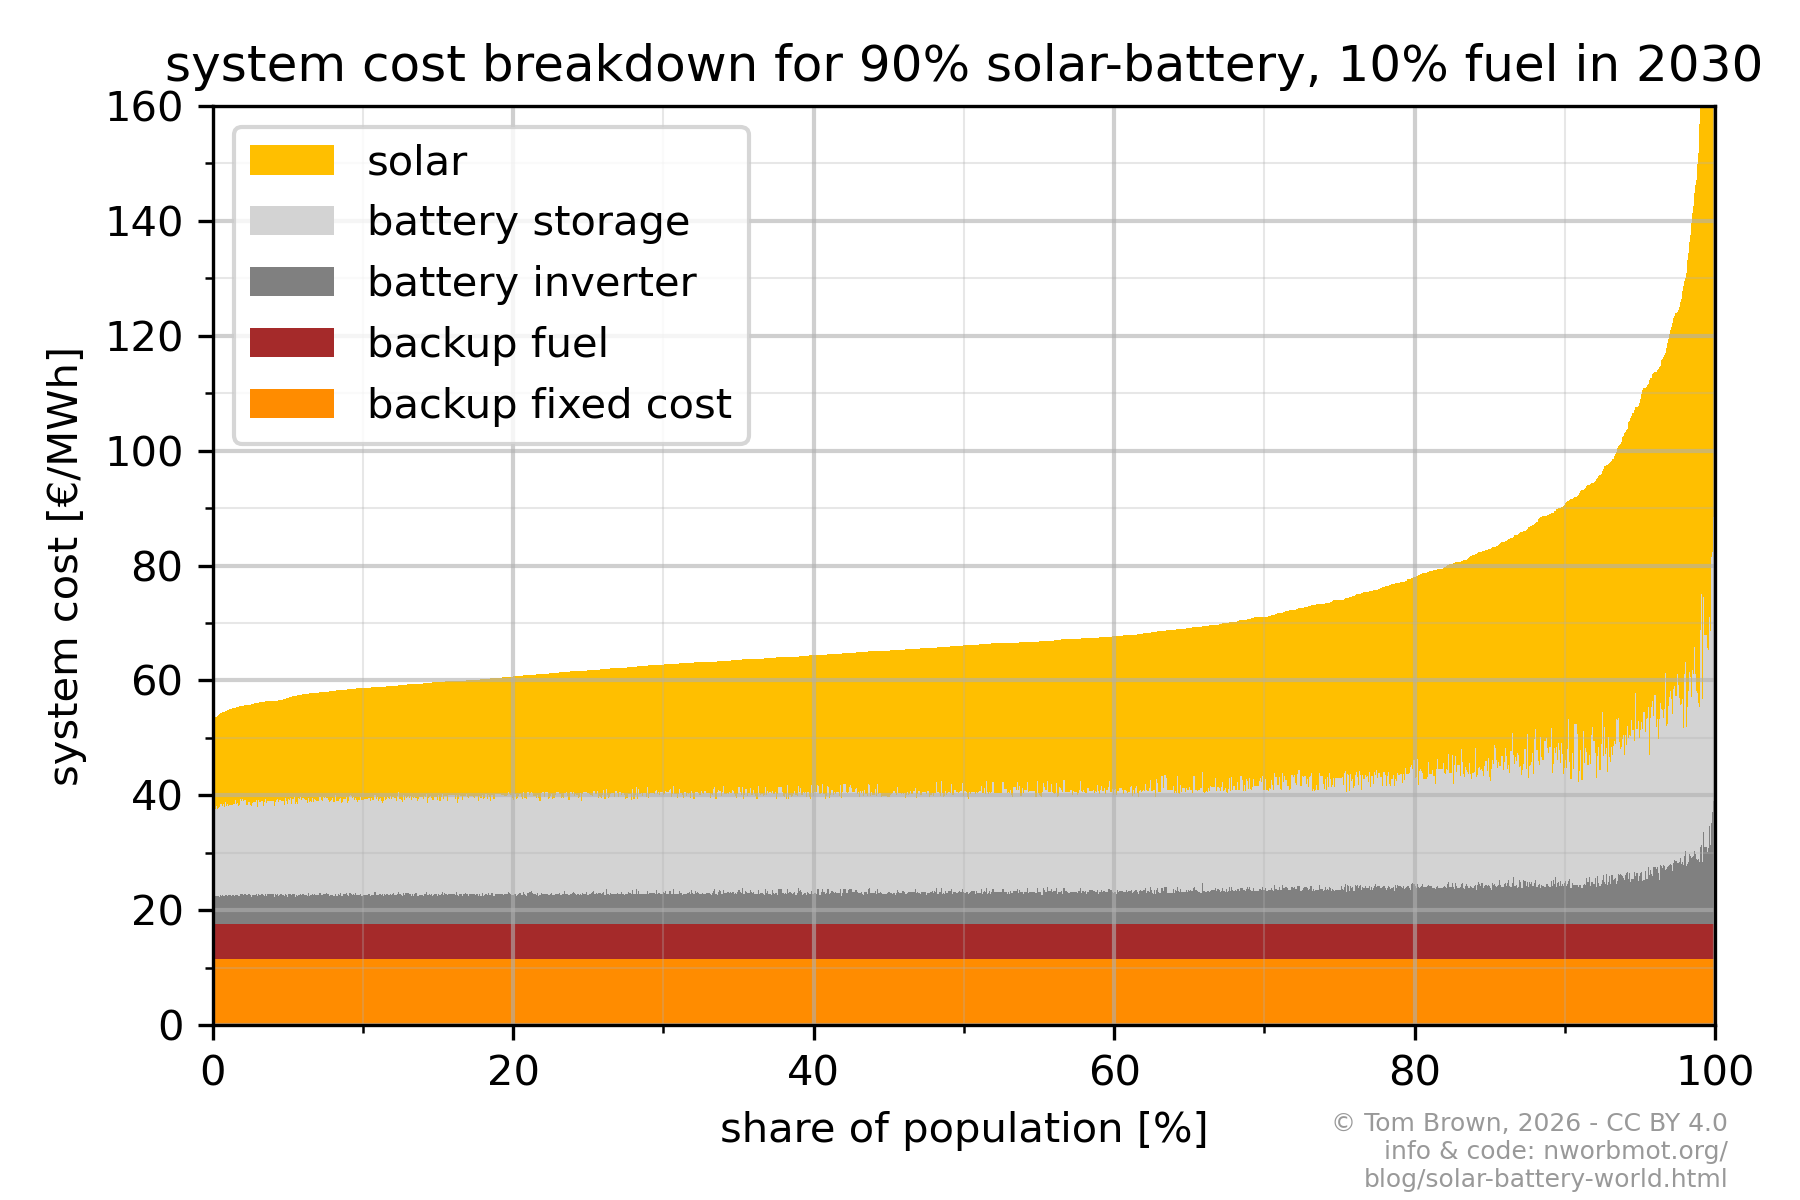
For 80% of the population it is below 80 €/MWh:
The more expensive locations are all at high latitudes in the North, where low sunshine in the winter increases backup costs. In these regions the addition of wind, existing hydro or other energy sources would help to alleviate the higher costs.
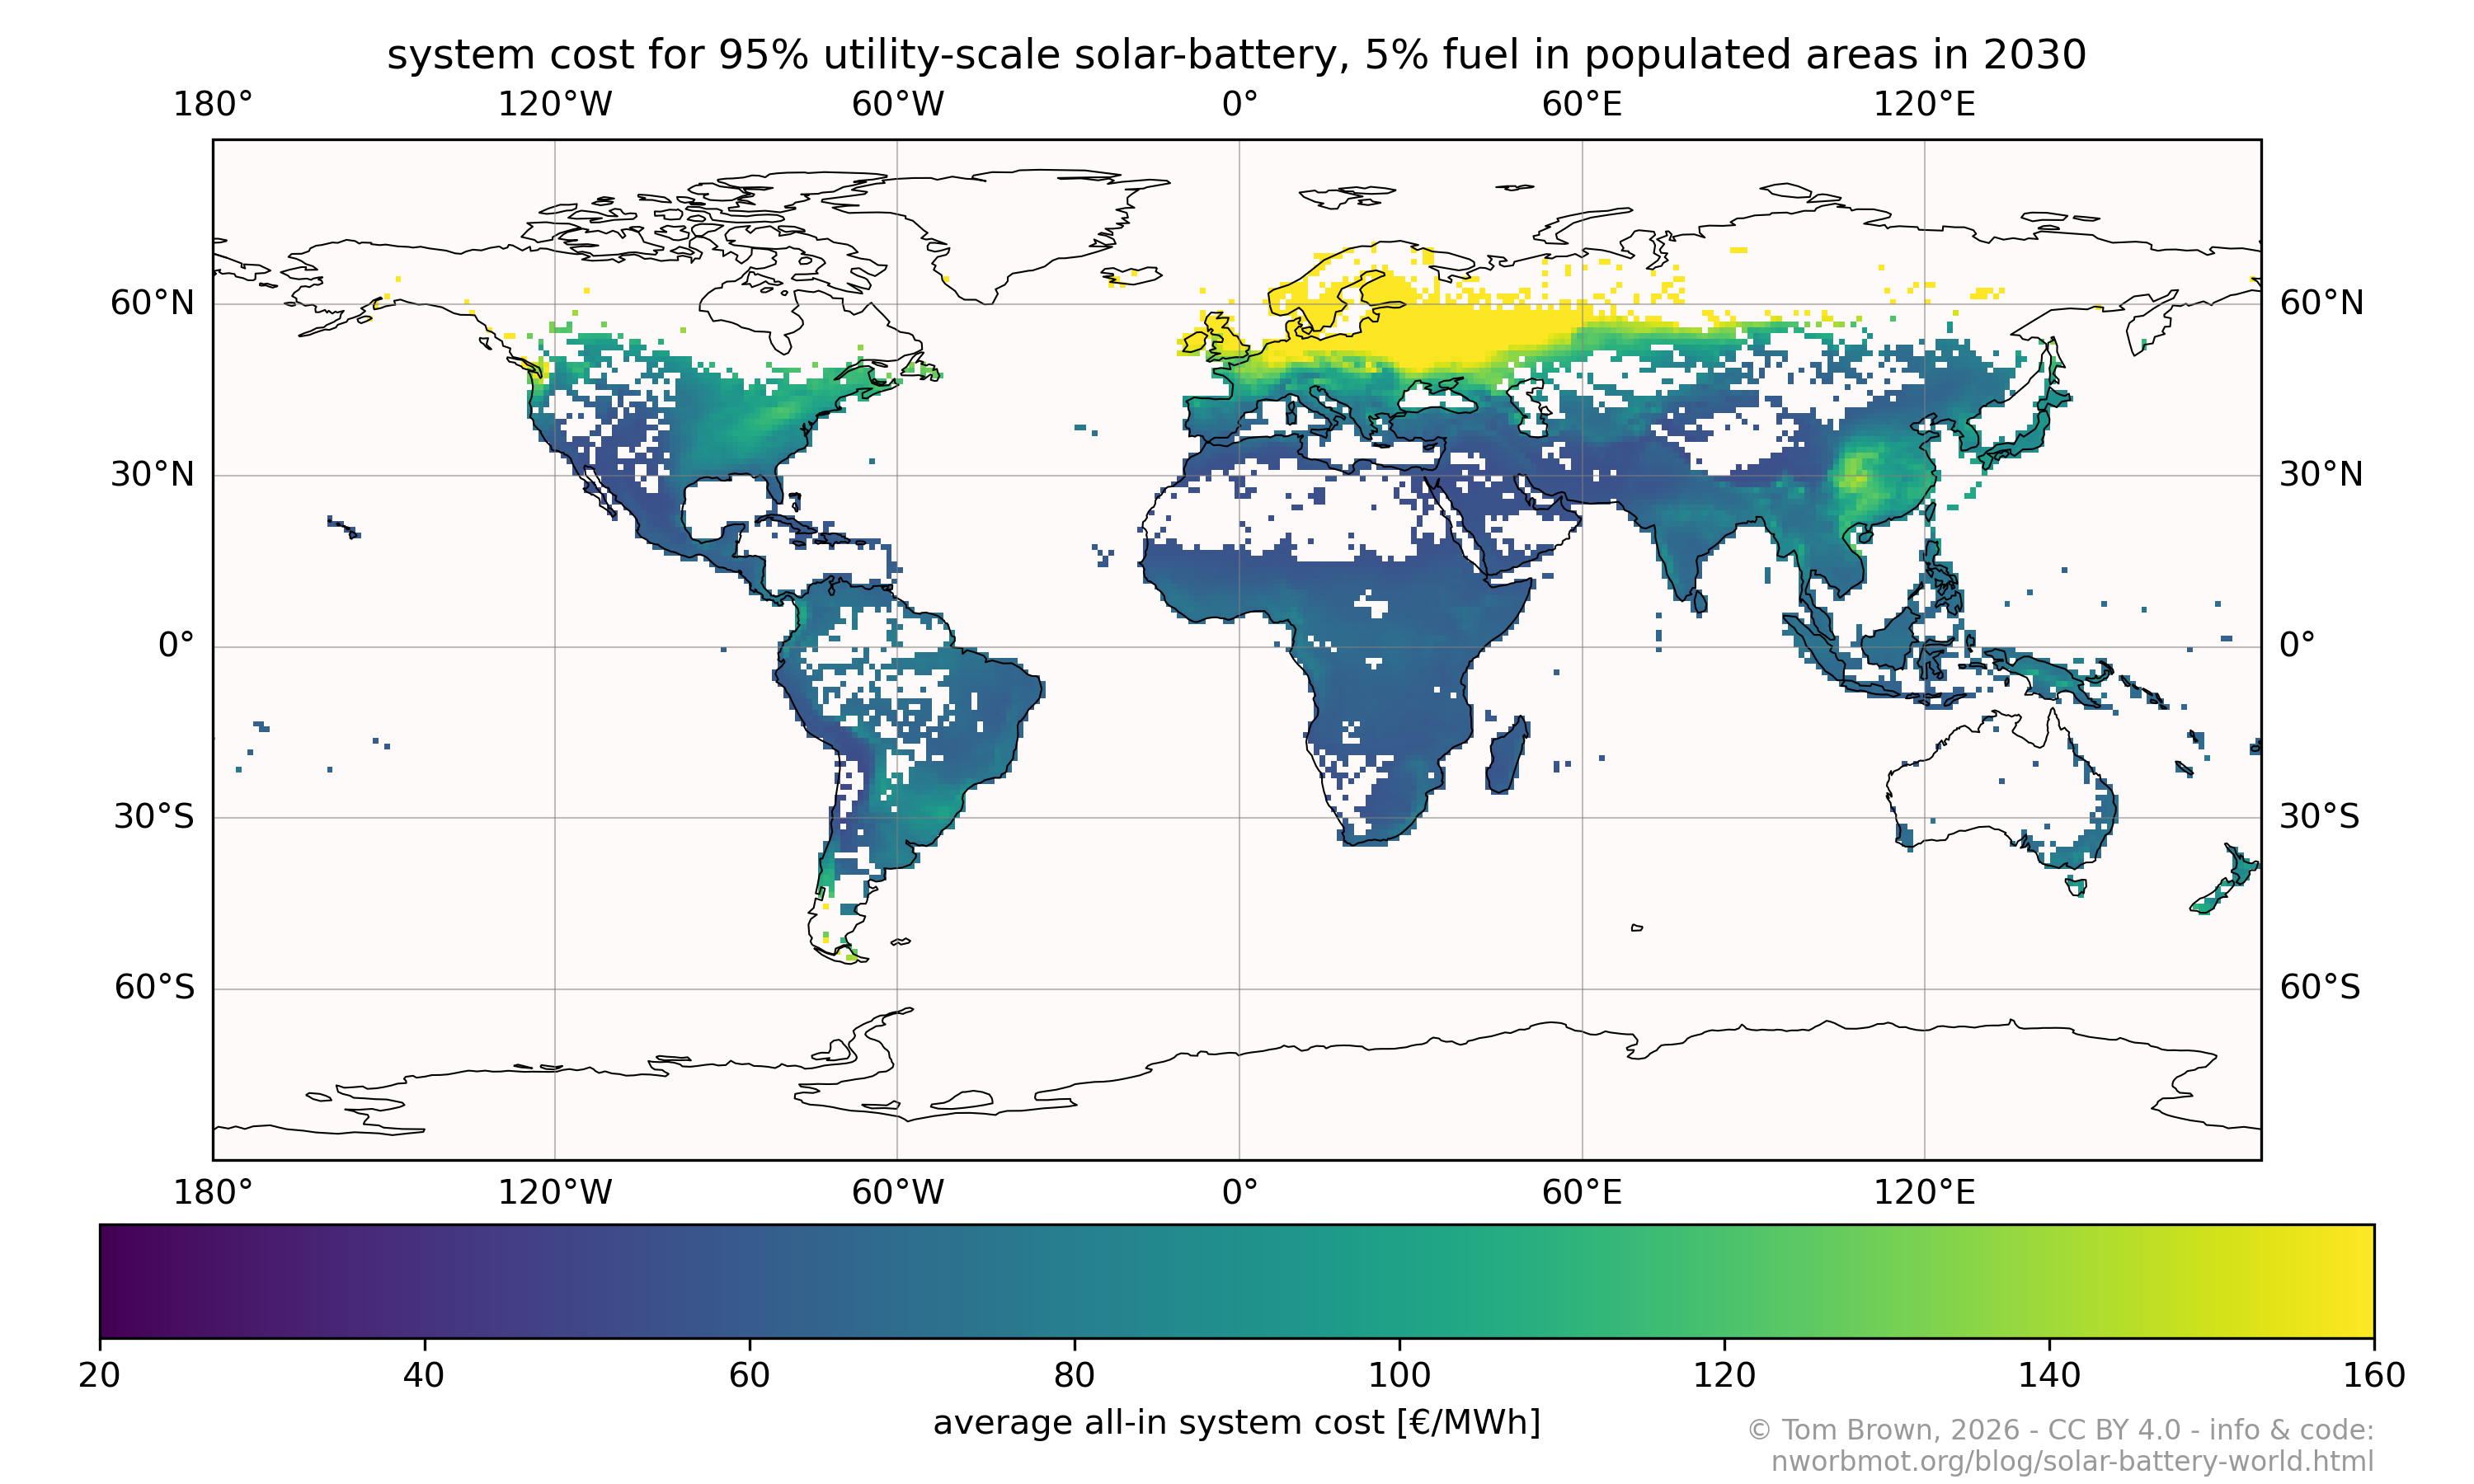
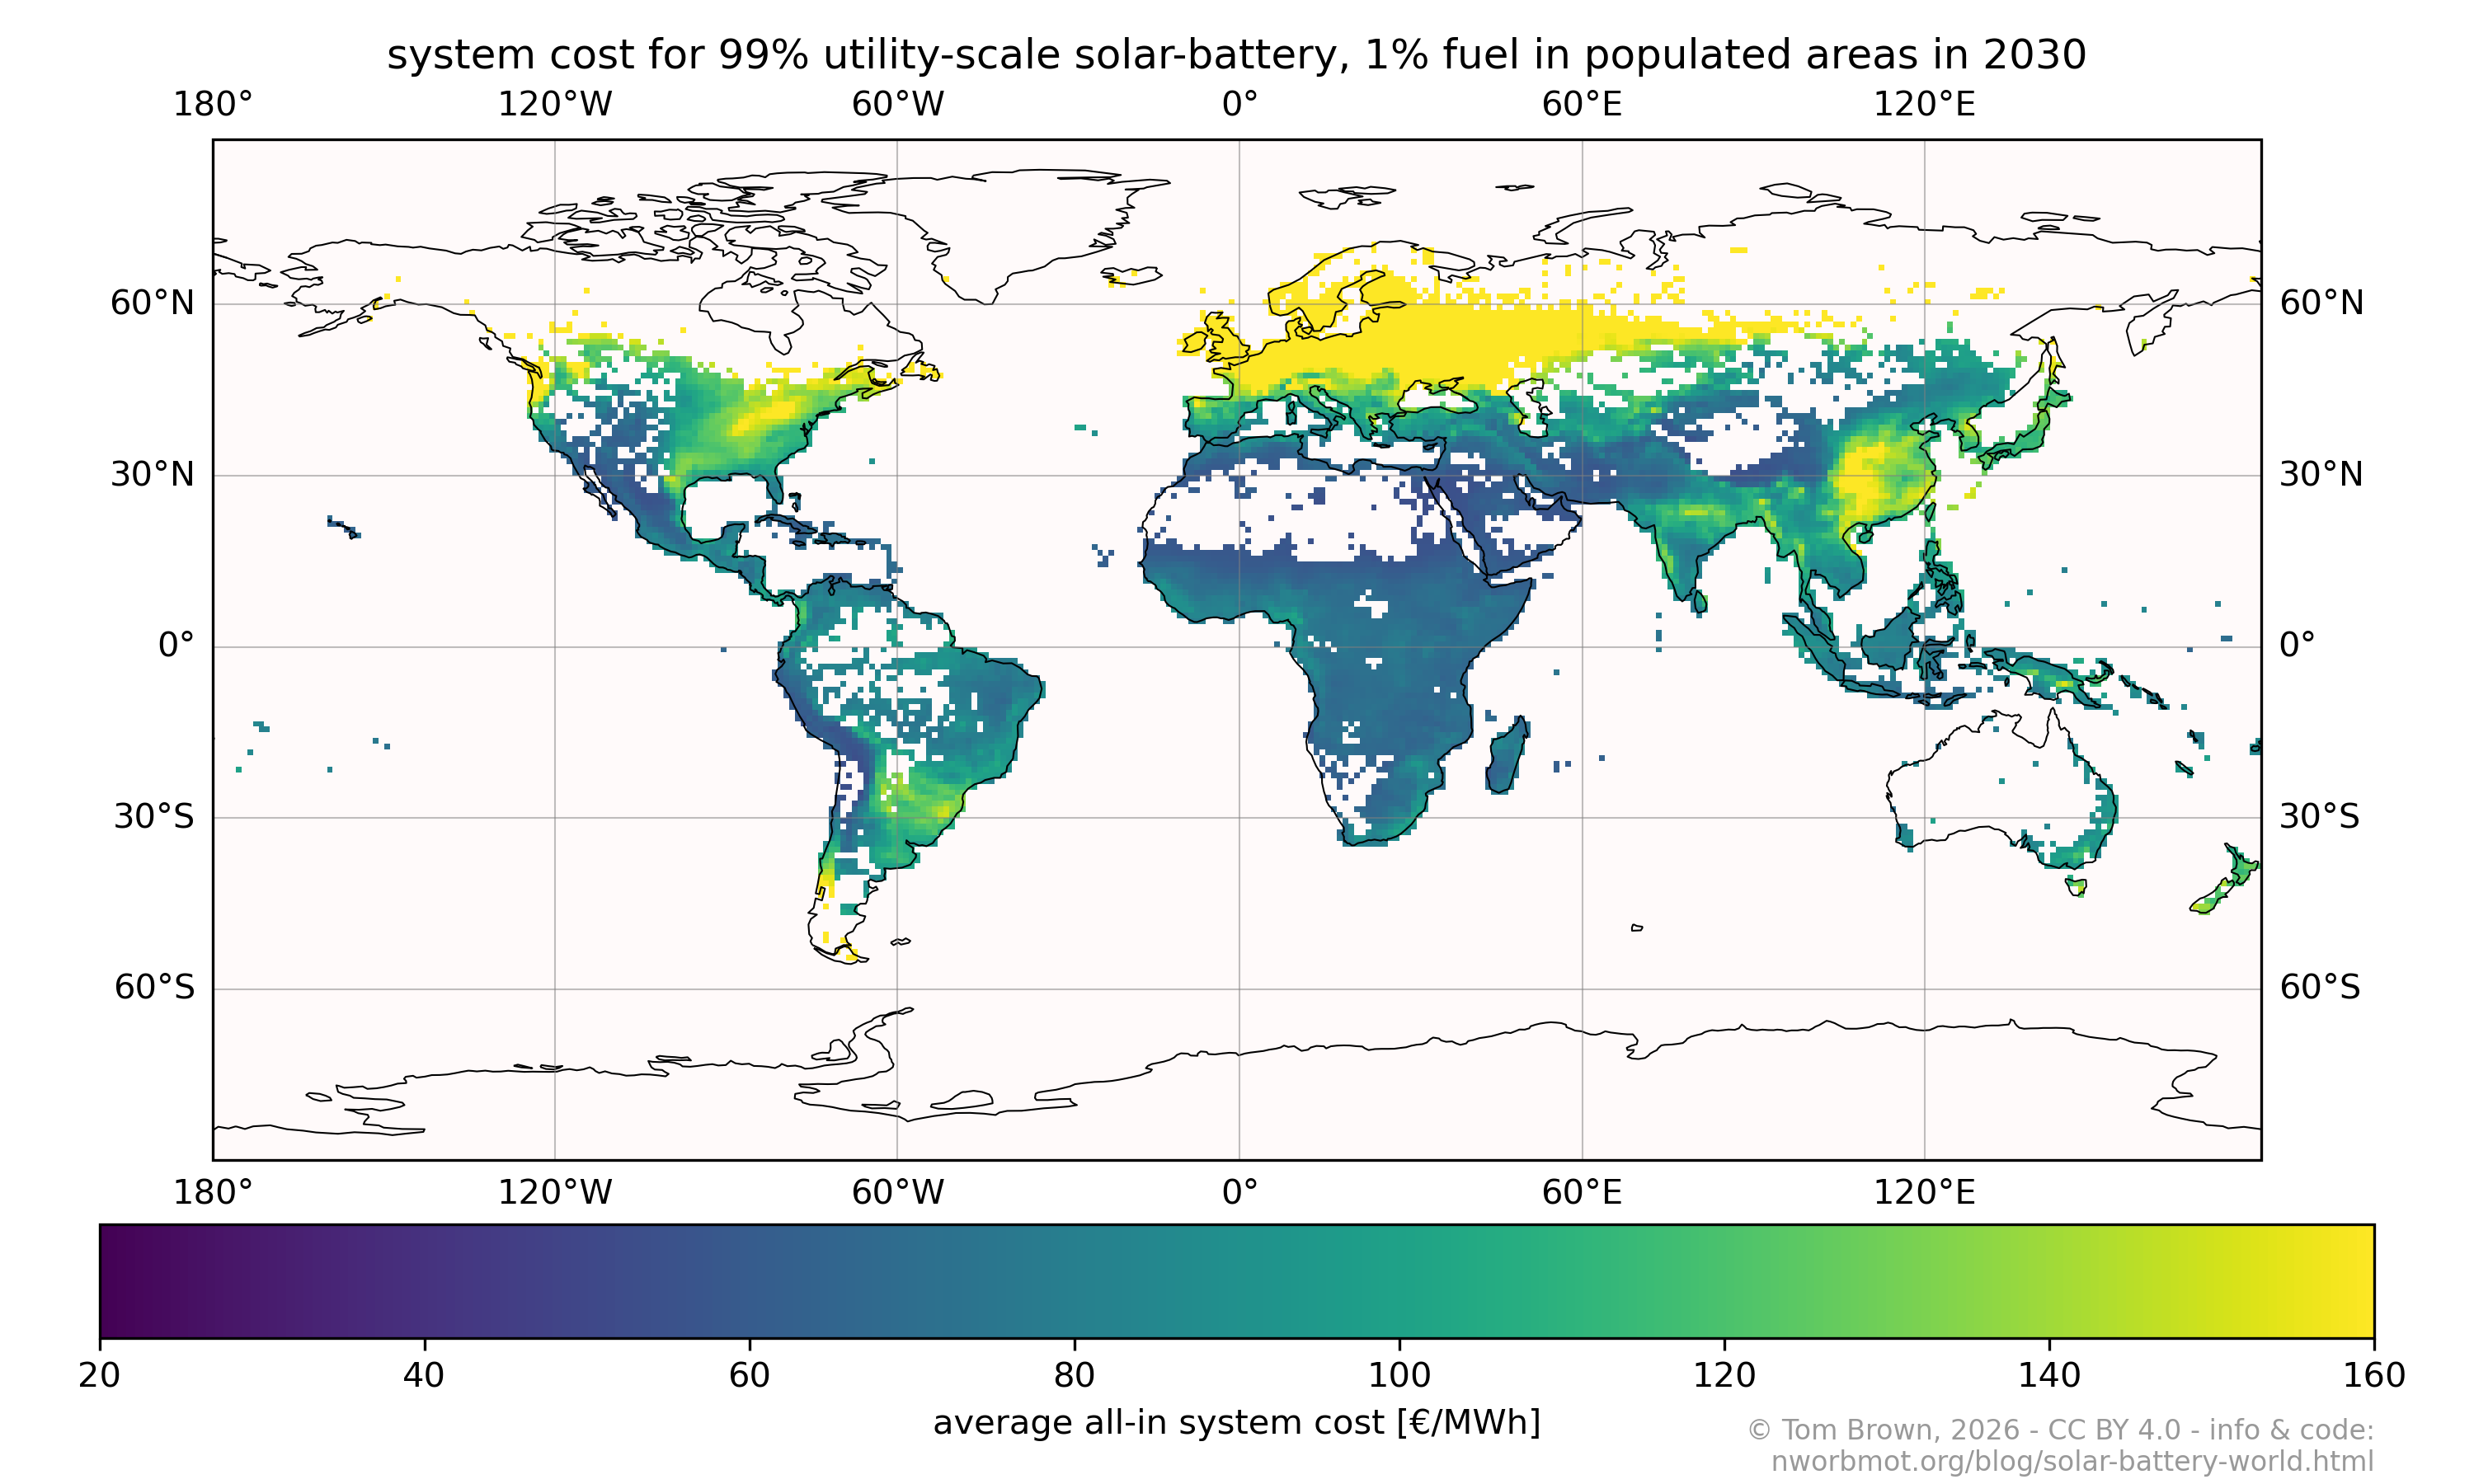
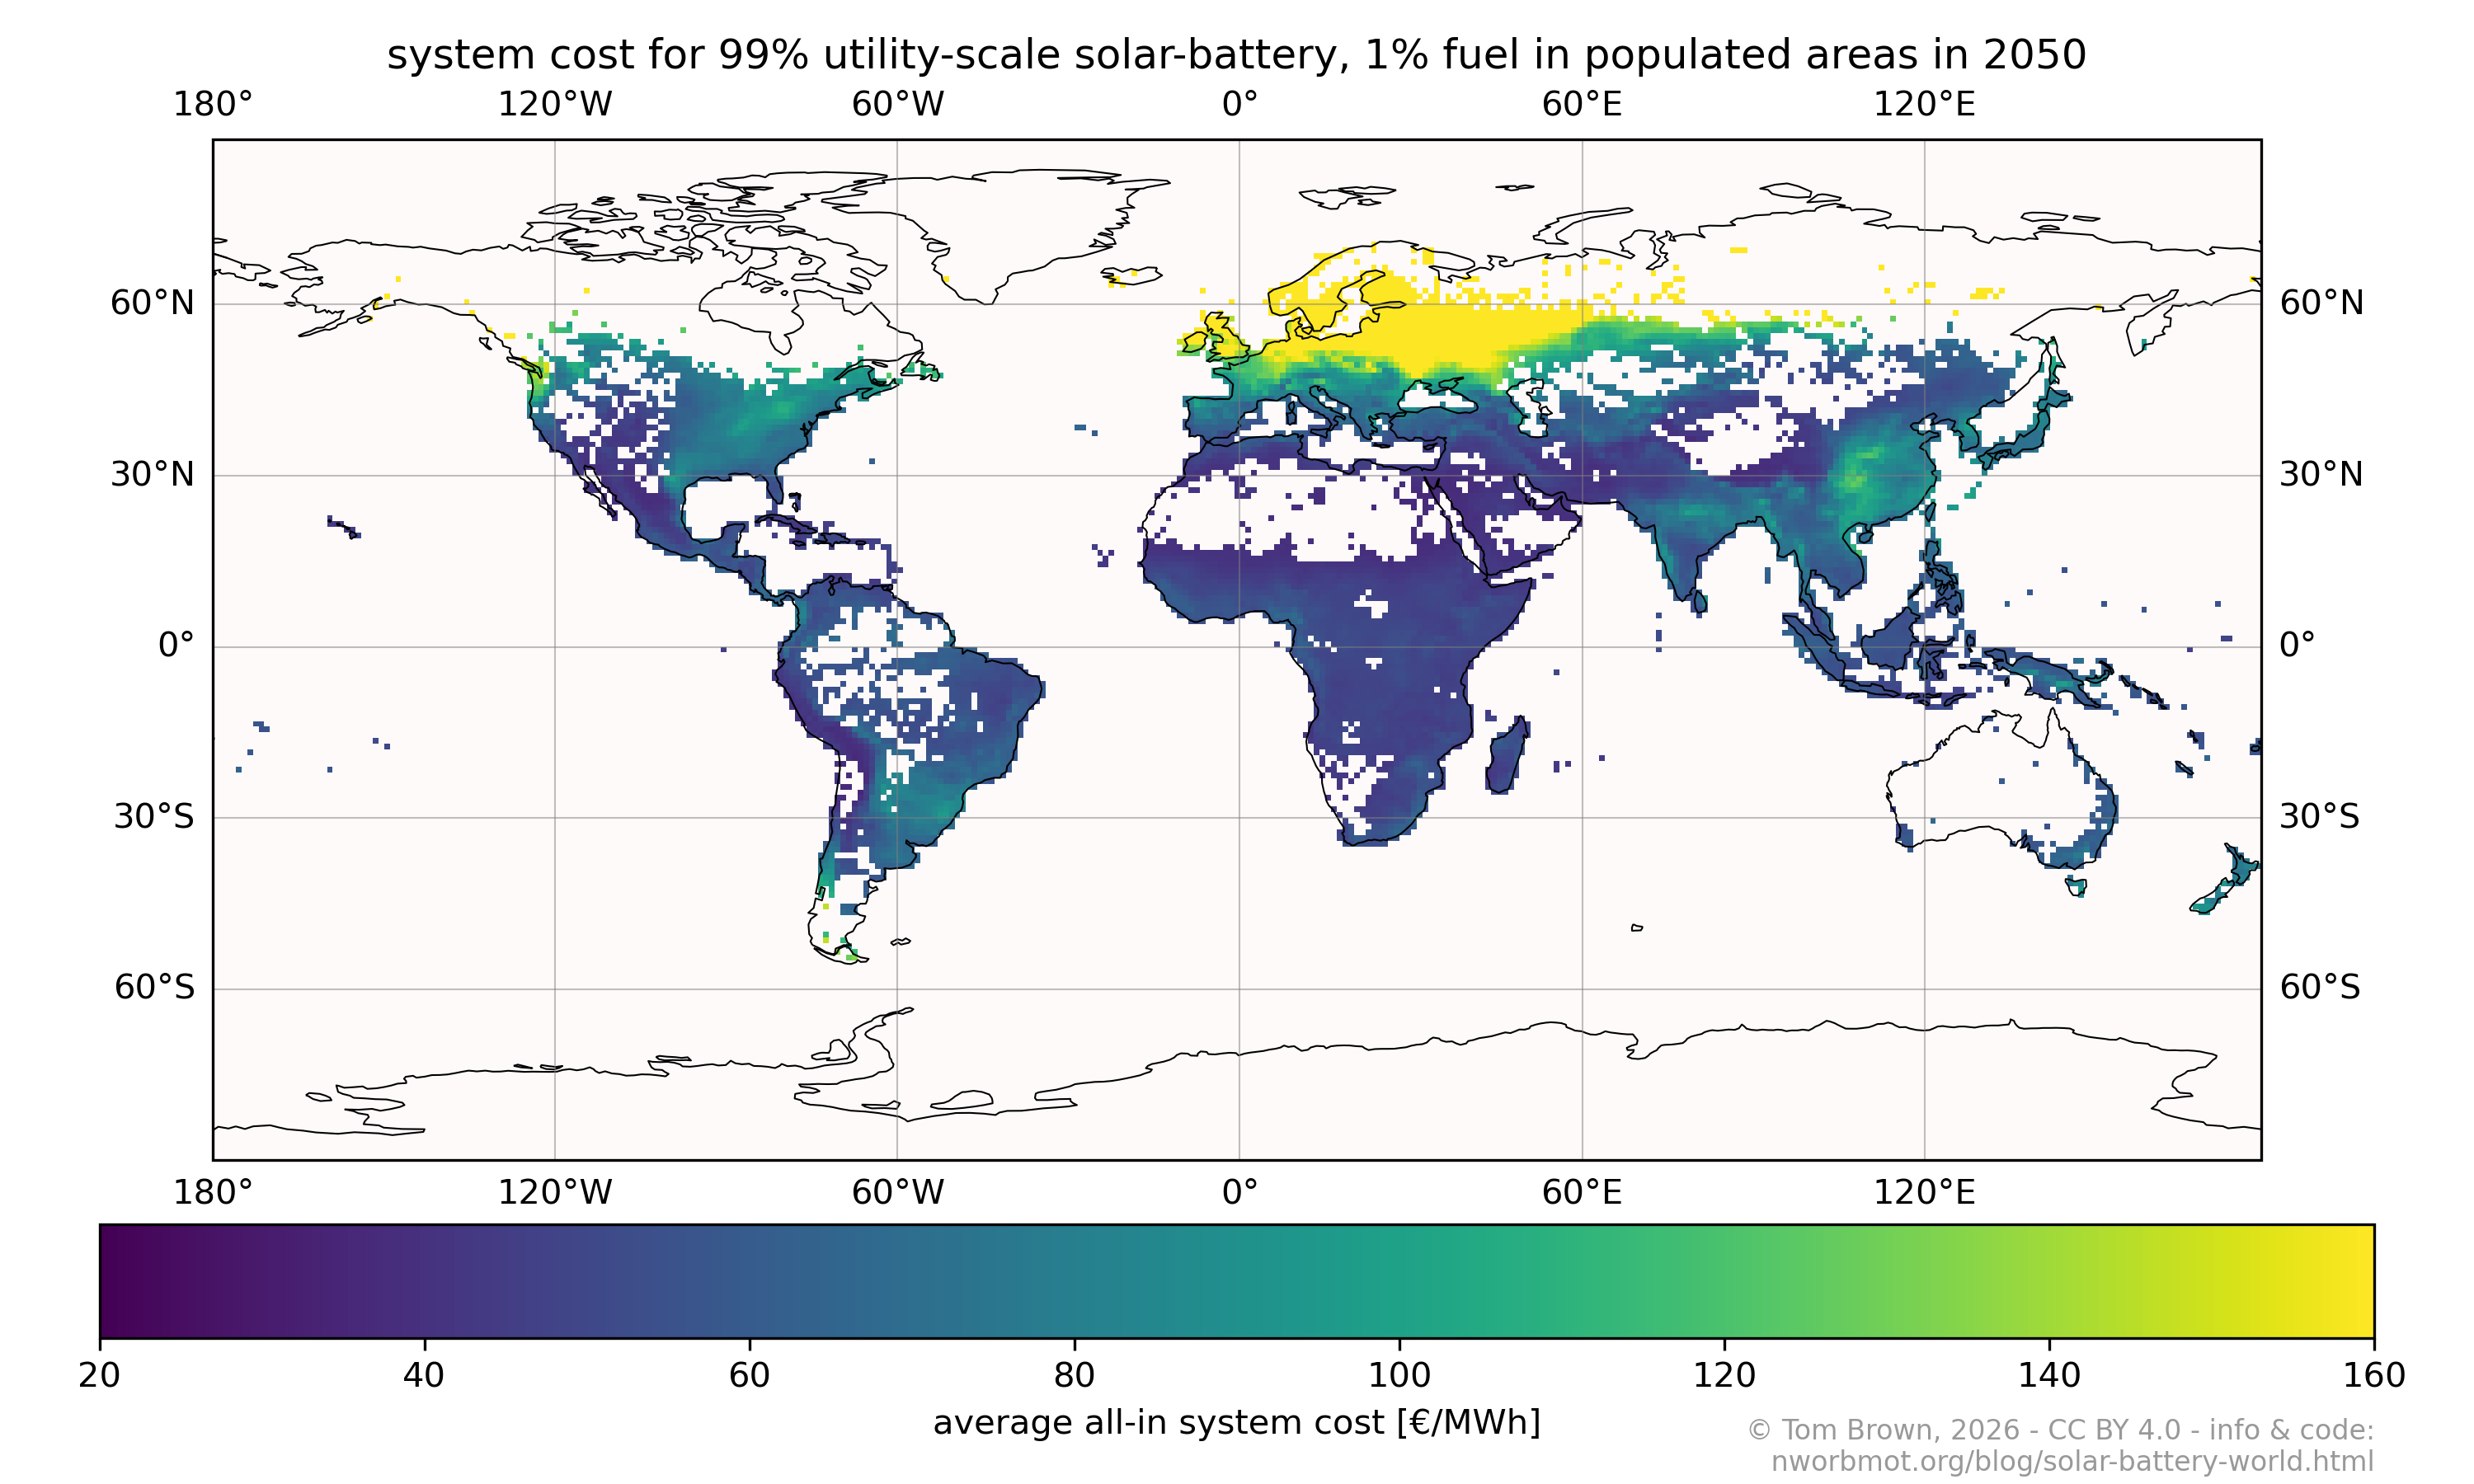
If we increase the solar-battery supply from 90% to 95% and 99%, the high-latitude regions have difficulty with the last 1-5% because of low winter sunshine.
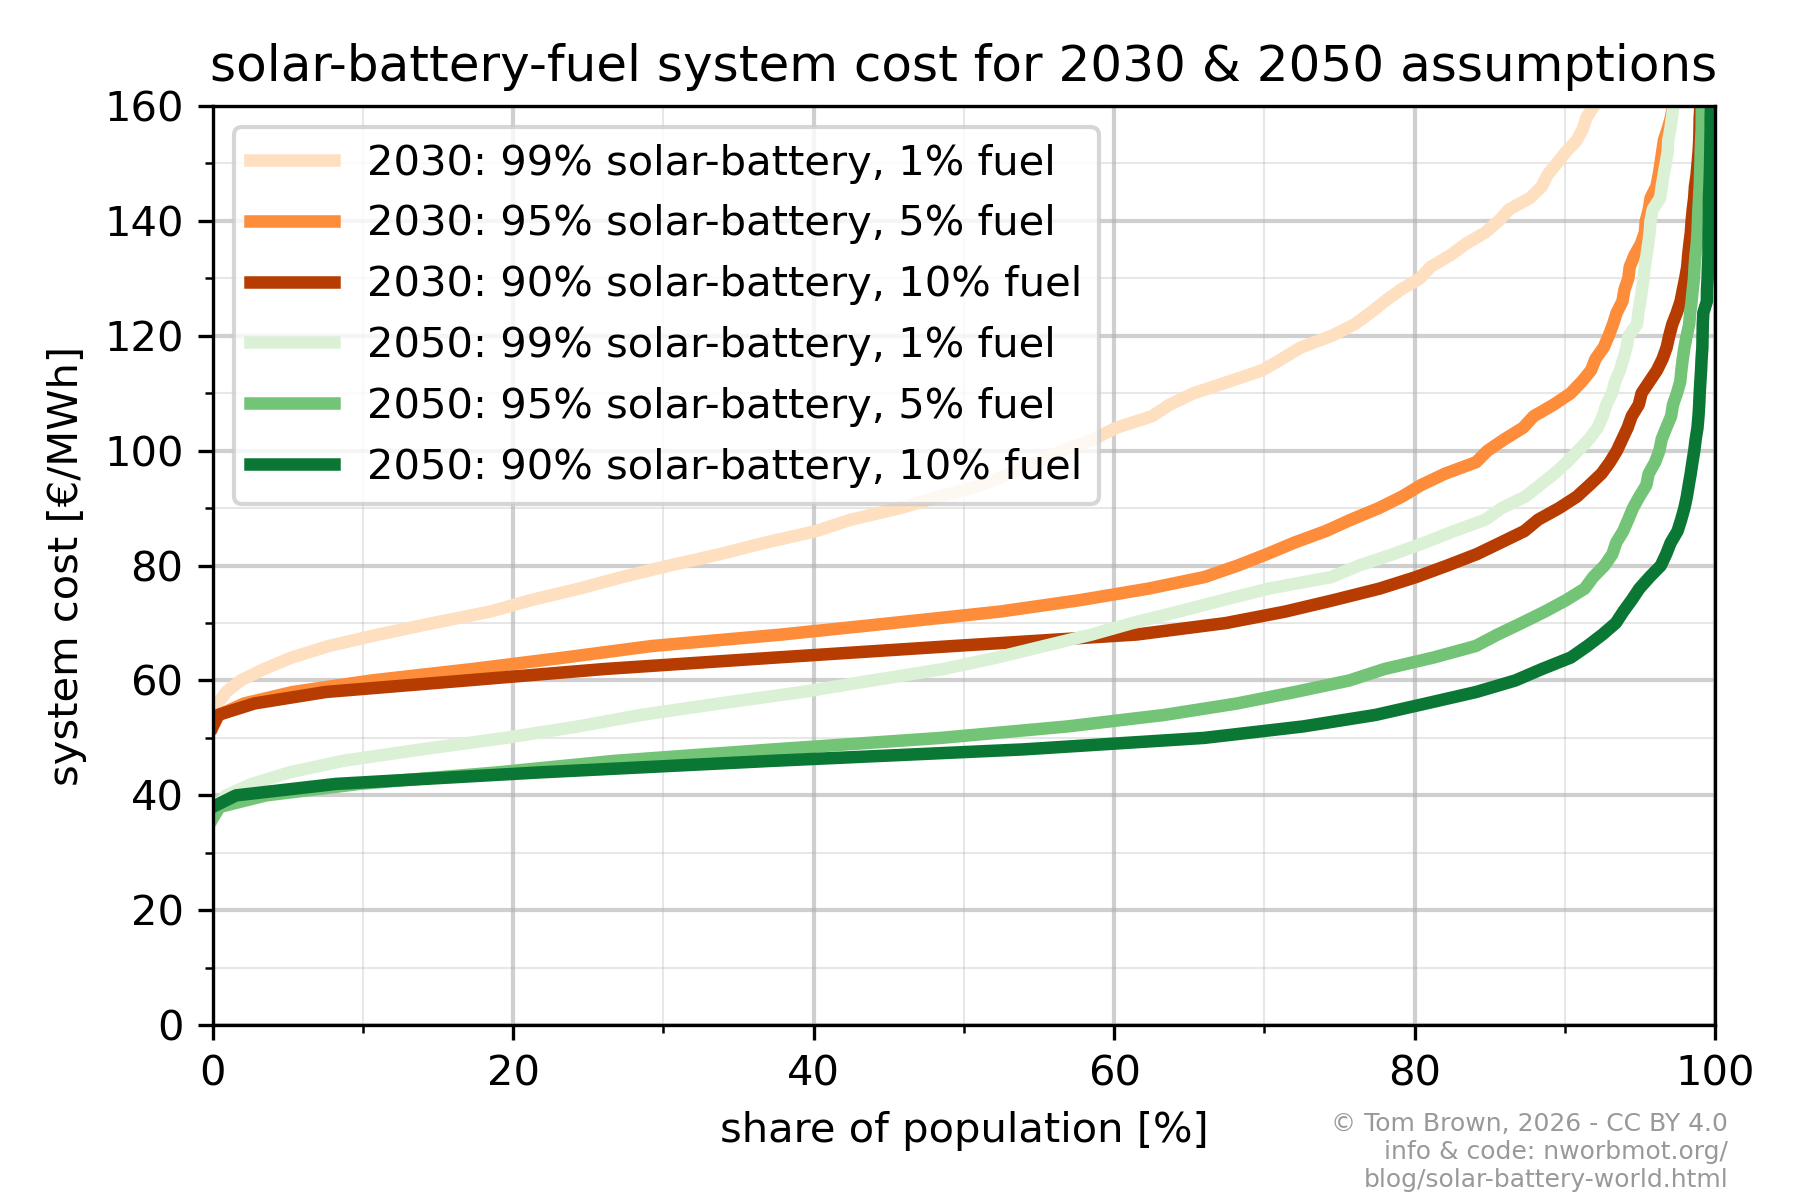
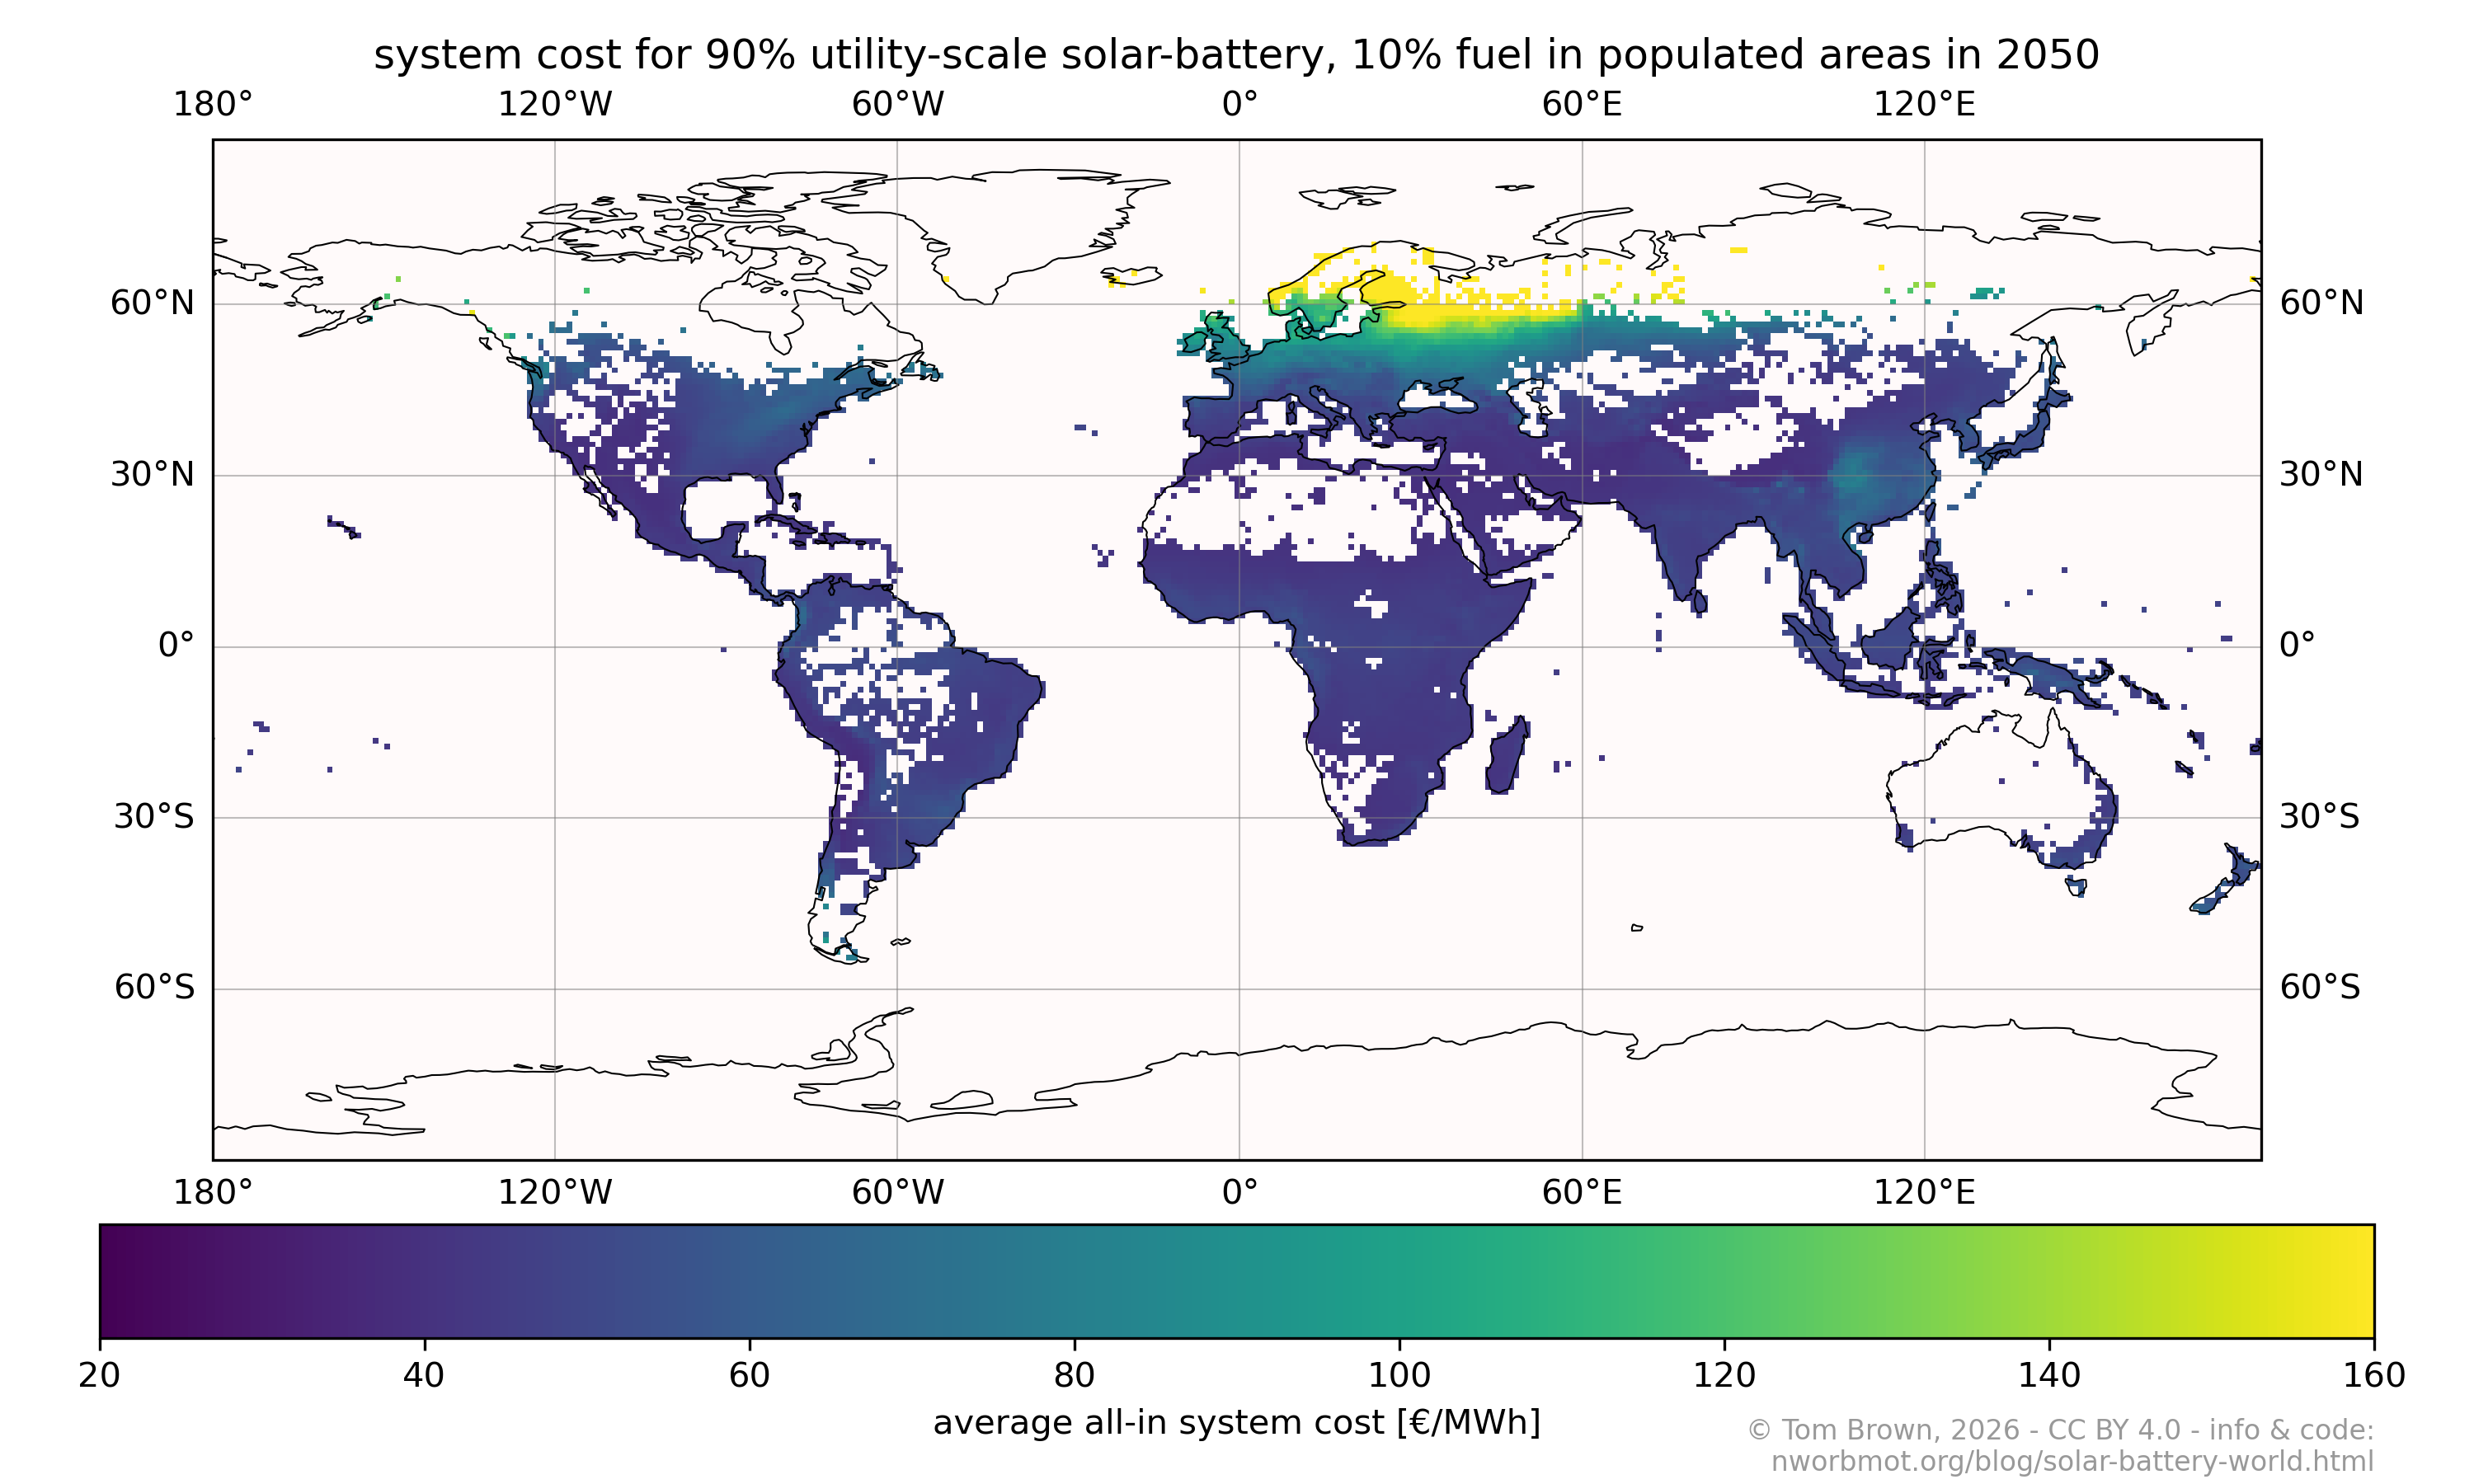
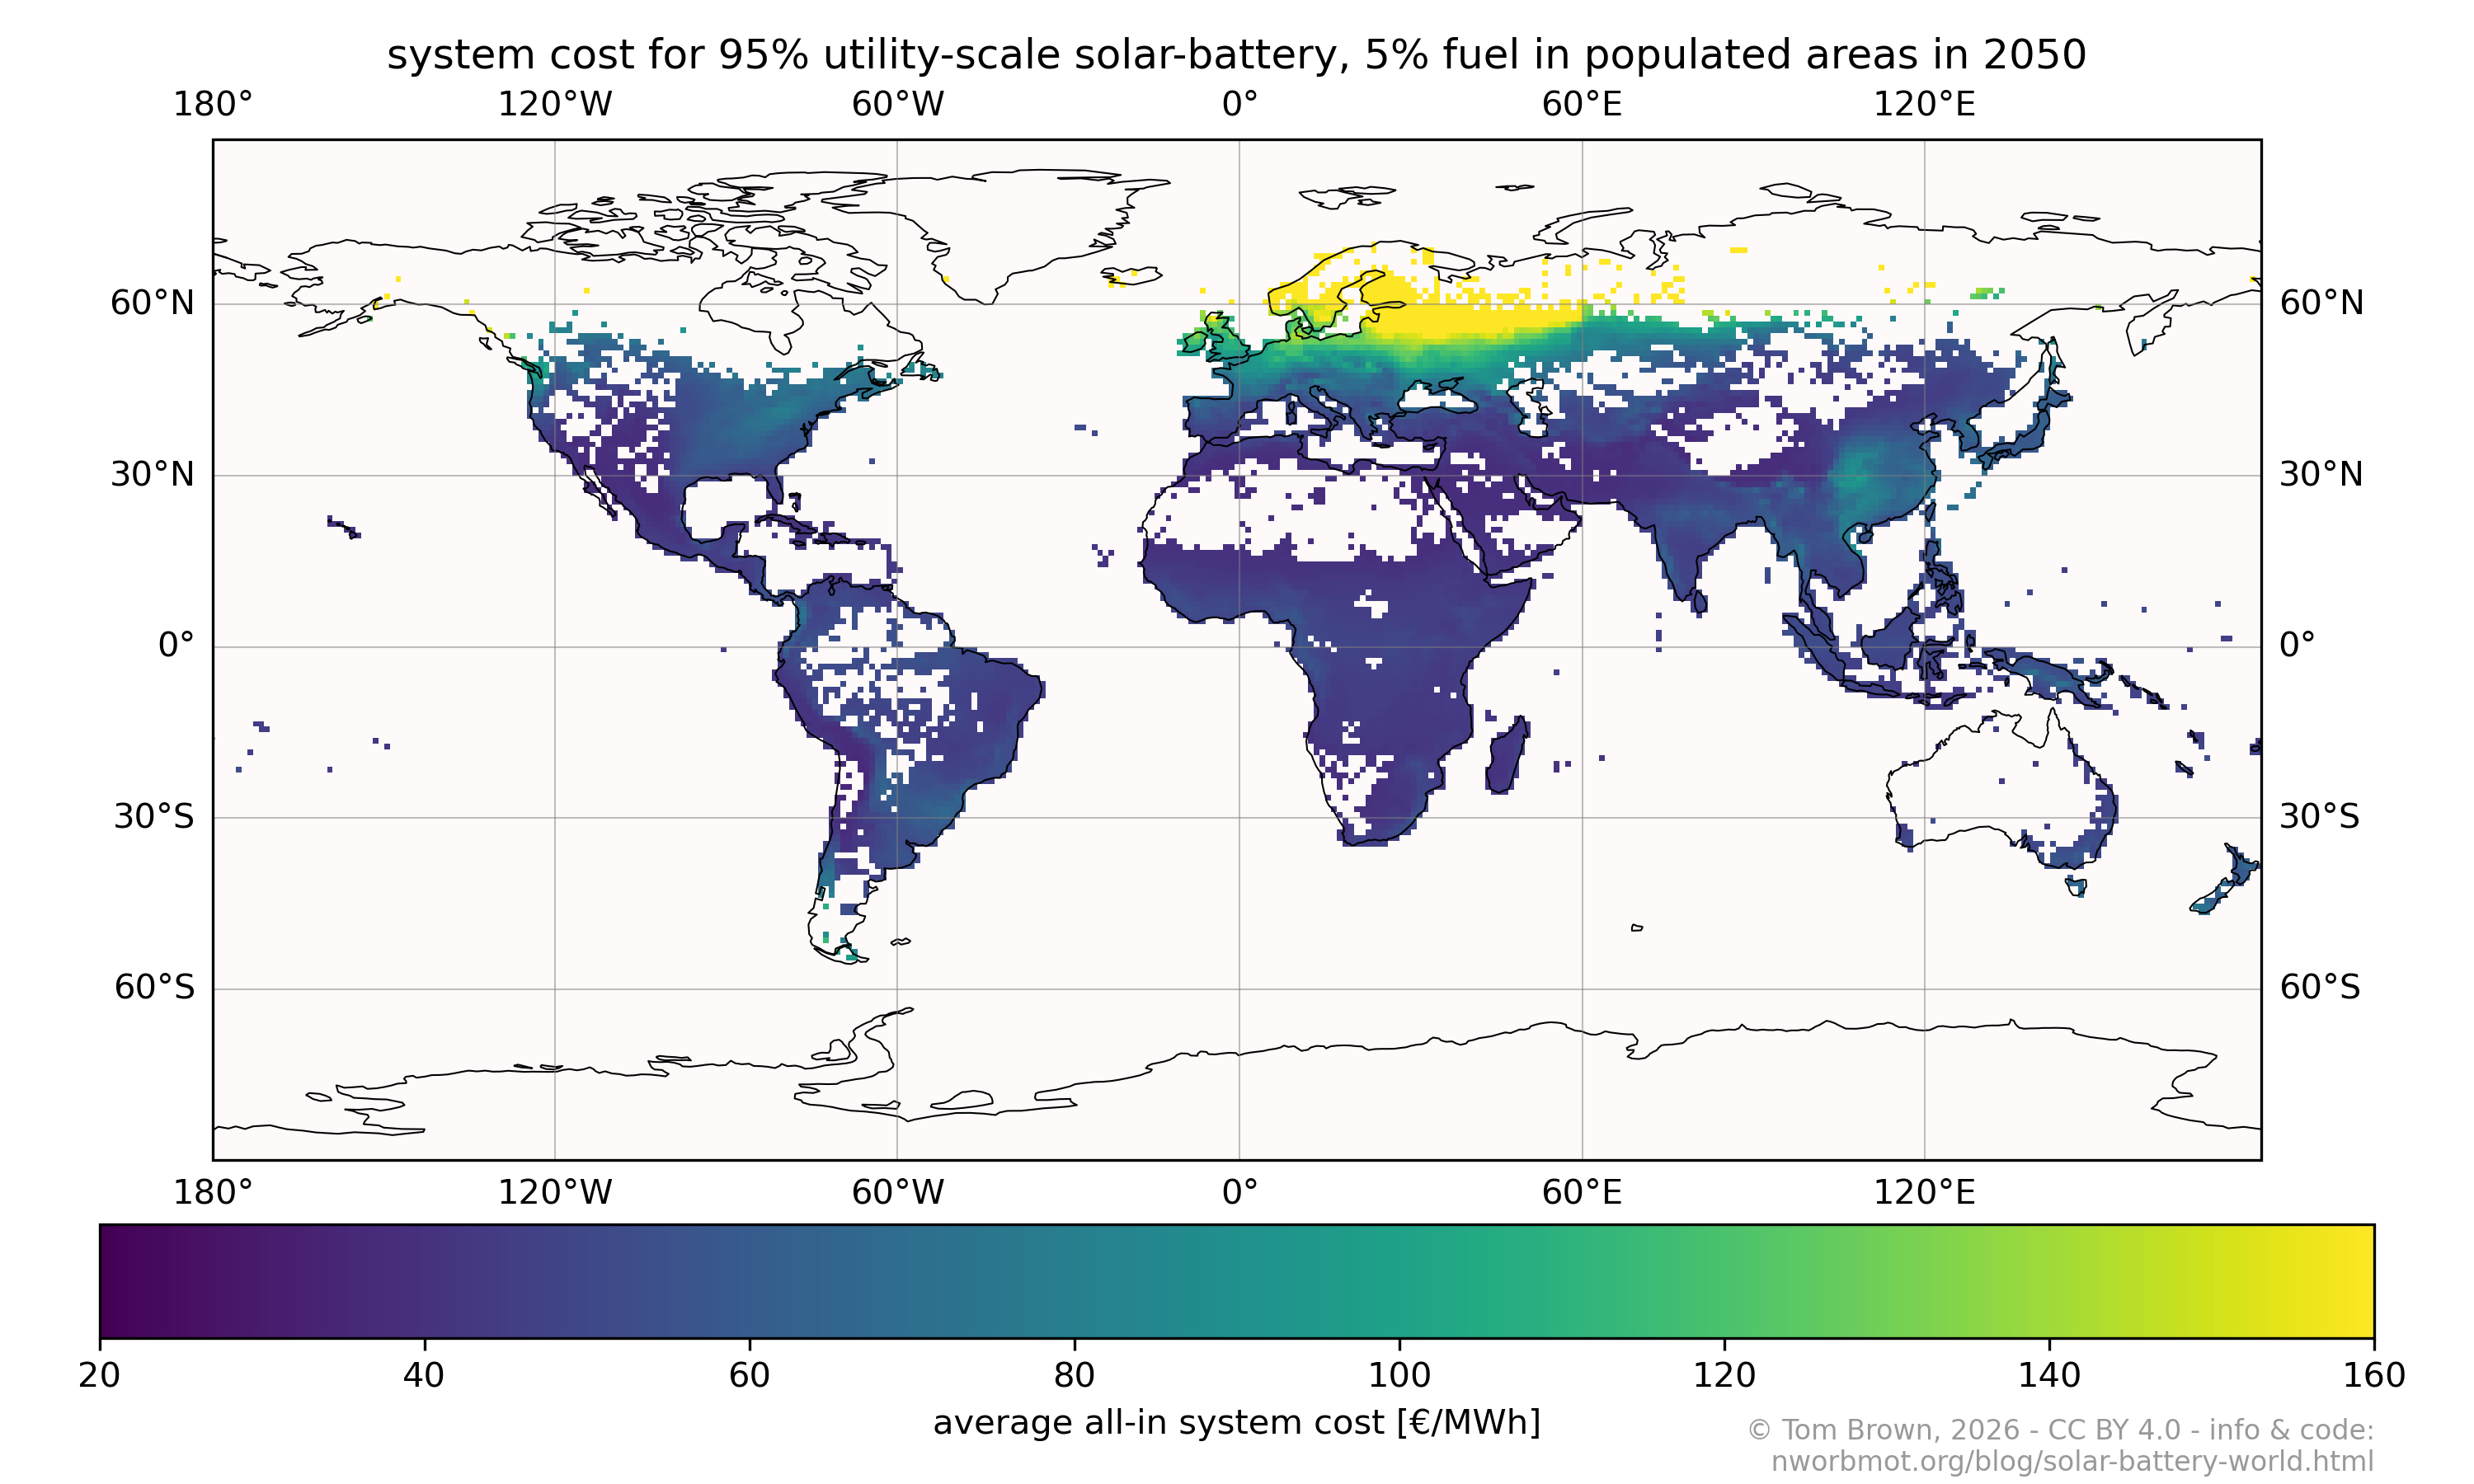
With projected cost reductions for solar and batteries in 2050, 86% of the population are below 60 €/MWh for 90% solar-battery supply, and 93% are below 80 €/MWh for 95% solar-battery supply.
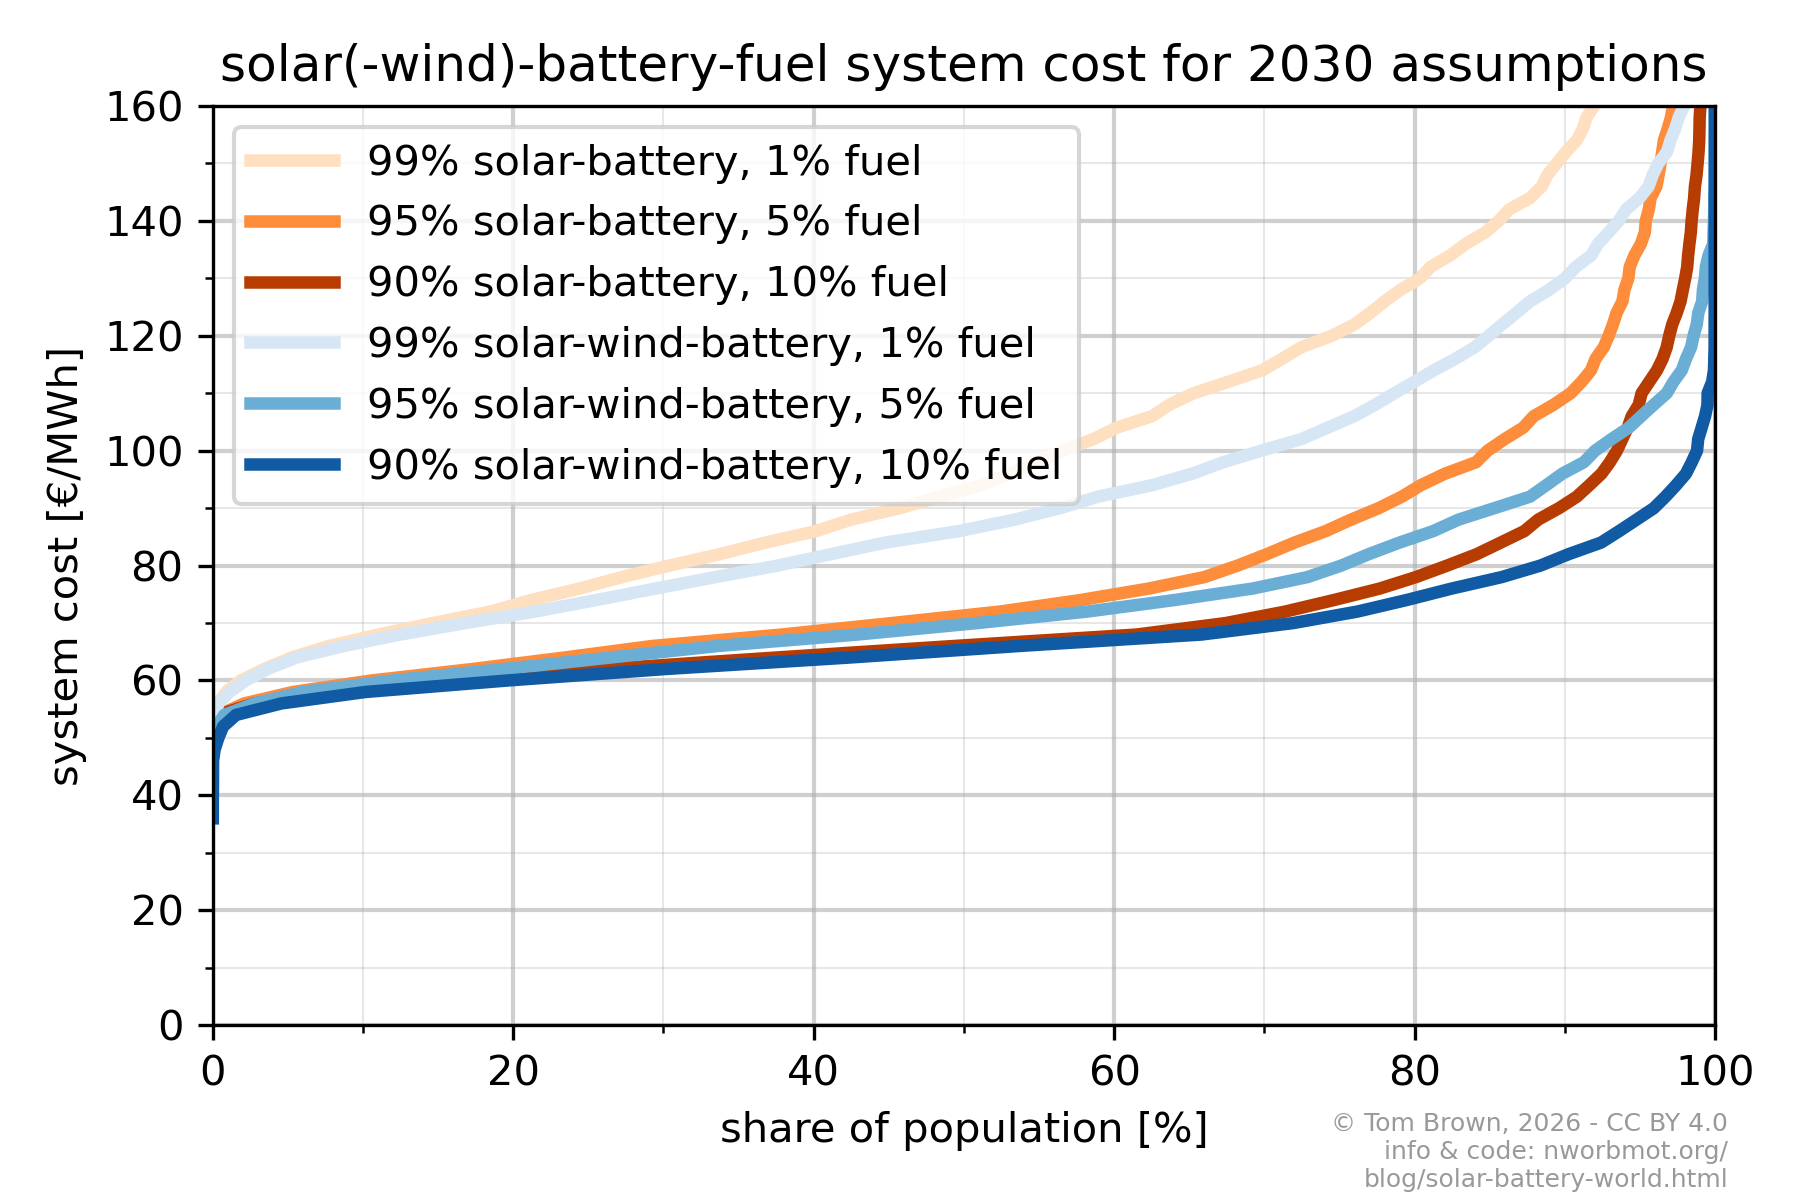
If we add wind in the case of 2030, this helps reduce costs particularly in high northern latitudes, where the wind tends to blow more strongly in the winter.
What conclusions can we draw?
- Solar and batteries have the potential to dominate electricity supply in most regions of the world, providing cheap and clean power.
- Where there is enough space, this supply can be provided close to demand (only minimal grid costs were included in these results).
- The more expensive regions are concentrated at high latitudes in the North, where seasonal variations make it attractive to include wind and other energy sources.
- We can get far without worrying about the last 5-10%. The solutions for the last 5-10% could be fossil fuels in the short-term, long-duration storage as it matures, or easily storeable e-biofuels.
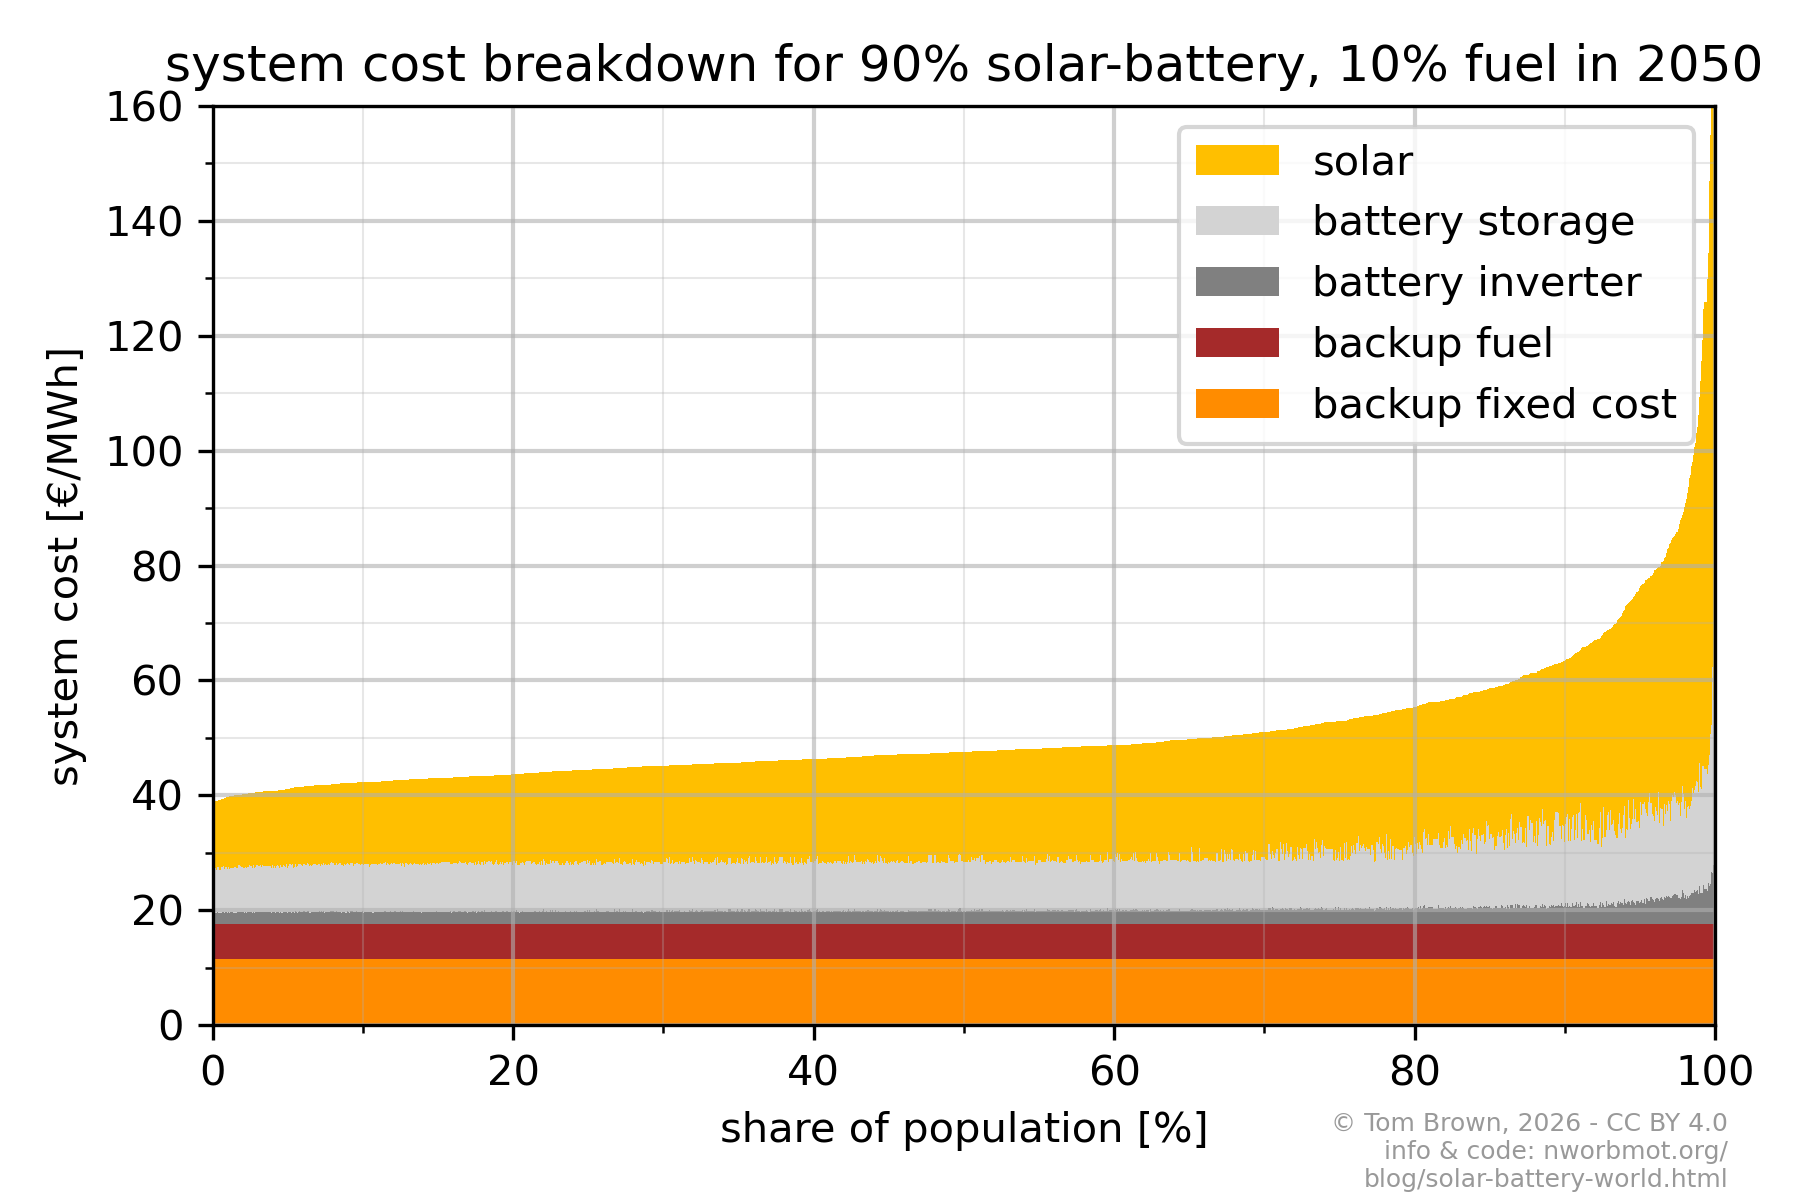
Briefly on the assumptions (more below): The system cost is higher than the solar levelised cost because it also includes the costs of the batteries and backup power for the full demand, as well as accounting for curtailment. Utility-scale solar PV and batteries are sized to minimise the costs for meeting a constant demand for each of the 8760 hours in weather data from 2011. The 1° by 1° pixels are chosen based on where the population is densest, representing where 99.9% of the population lives. The model is based on model.energy but without the hydrogen storage. The most important economic data is based on the Danish Energy Agency Technology Database for 2030 in 2020 euros: solar PV installed cost 384 €/kWp, lithium-ion battery installed cost 157 €/kWh. By 2050 these reduce to 293 €/kWp and 83 €/kWh respectively. The solar costs include 50 €/kW for transformer and grid connection, but no further grid costs are included. Additional assumptions: cost of capital 5%, cost of backup generator with 50% efficiency 1000 €/kWel, cost of backup fuel (based roughly on fossil gas) 30 €/MWhth. There is more information below including instructions on how to adjust the results if you don't like the inputs.
Table of Contents
- 1. More technical details
- 2. Warnings
- 3. Open code and data
- 4. Land and material use
- 5. Additional results
- 5.1. Population density versus system cost in one plot
- 5.2. Additional plots for main 90% solar-battery scenario
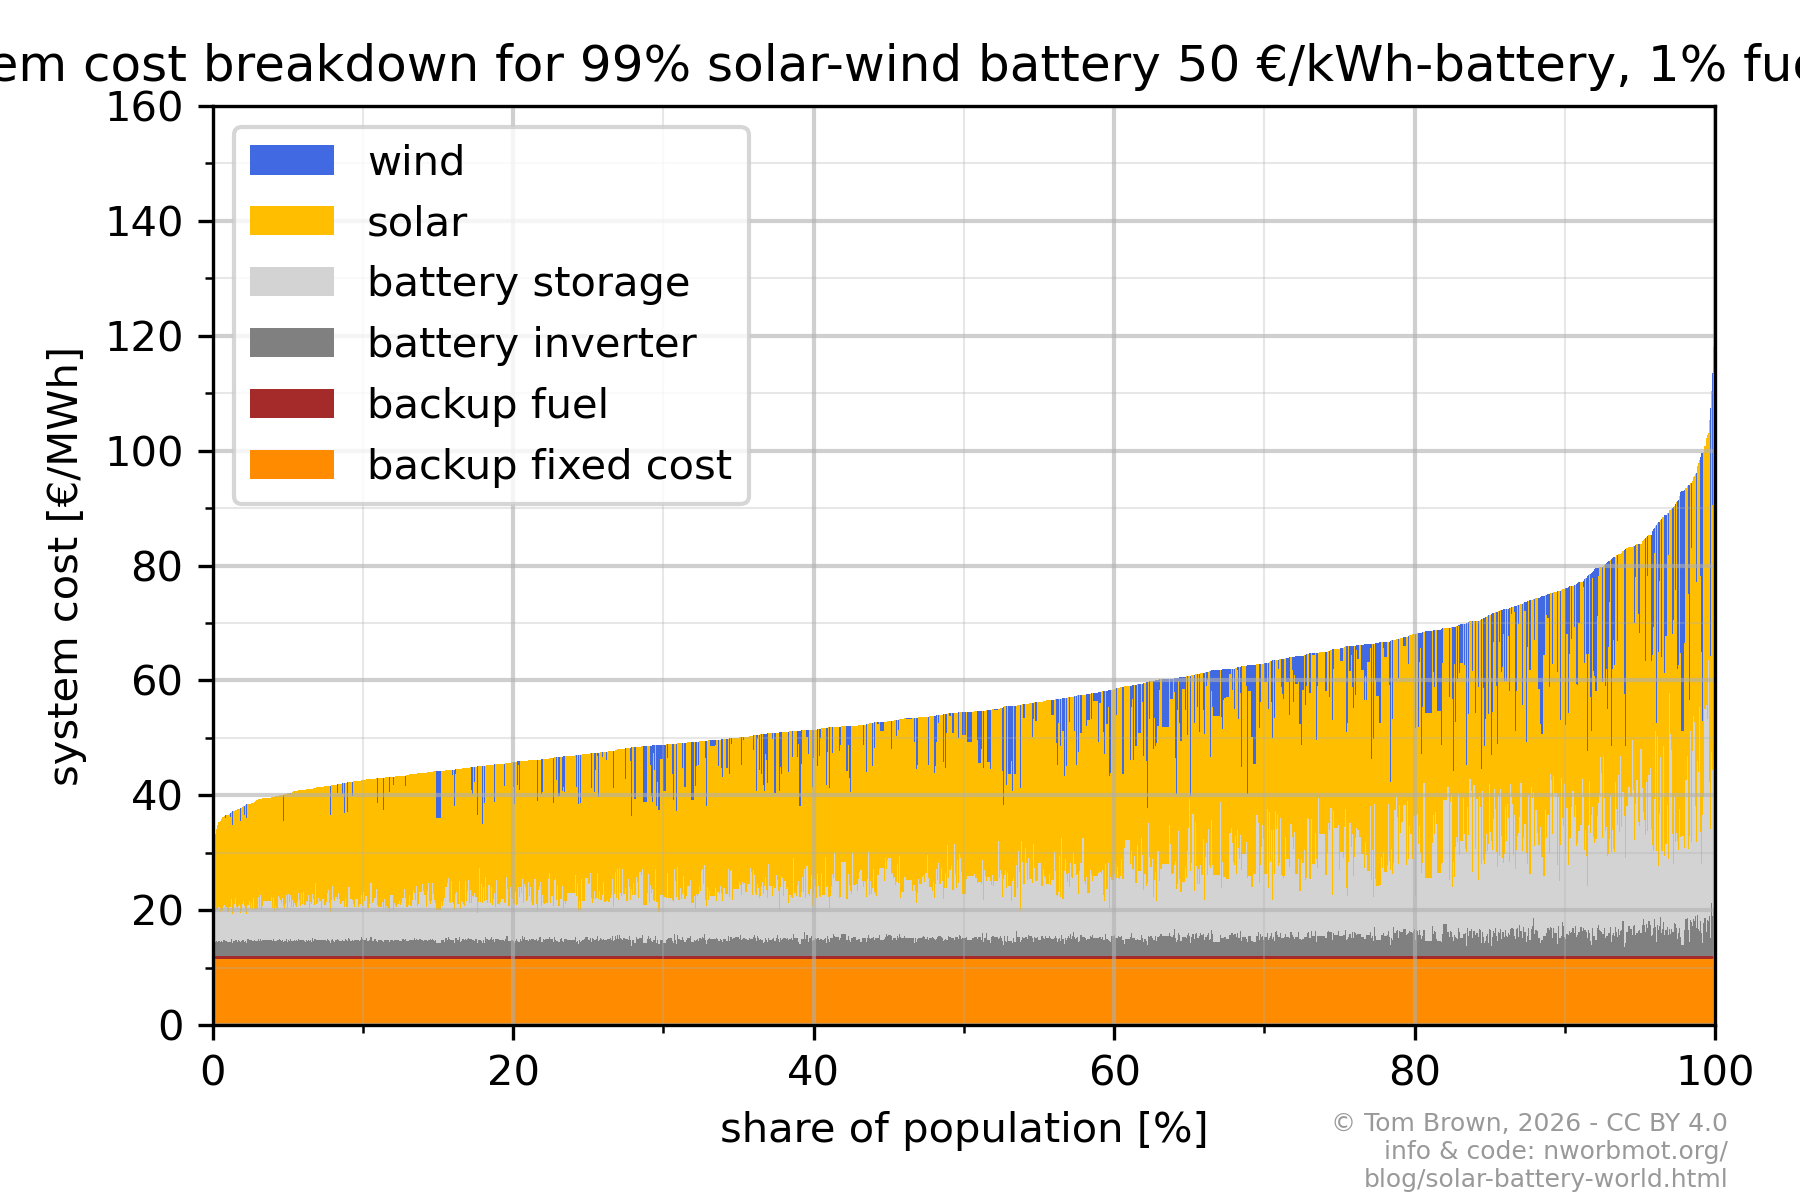
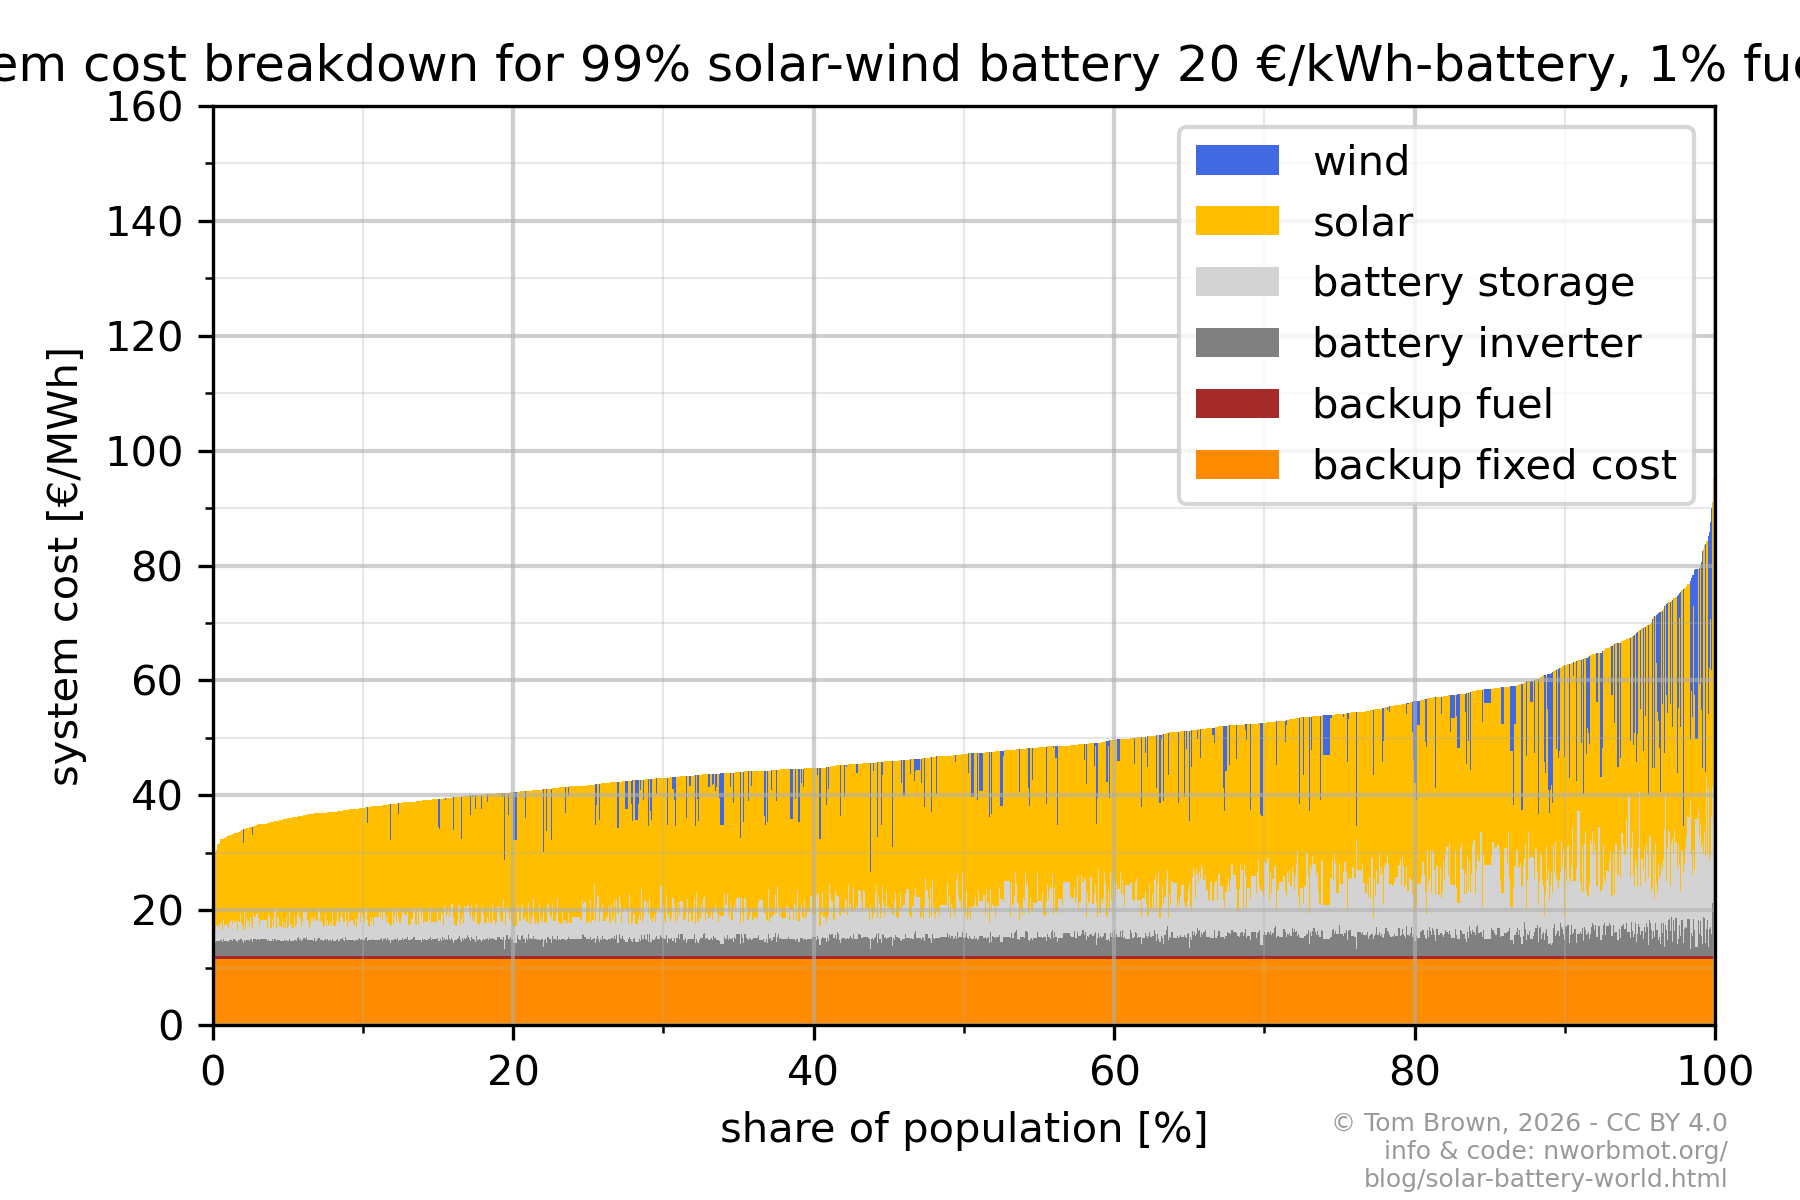
- 5.3. 2050 results with battery investment cost reduced from 83 to 50 and 20 €/kWh
- 5.4. 2030 cost increase for solar-wind-battery when removing wind
- 5.5. Maps of other scenarios
- 5.6. Stacked costs for other scenarios
1. More technical details
The full set of technical assumptions, mostly leaning on the Danish Energy Agency Technology Database, can be found here:
https://github.com/nworbmot/solar-battery-world/blob/main/defaults.csv
As well as the incremental energy cost for the lithium-ion batteries, an inverter cost of 177 €/kW in 2030 and 66 €/kW in 2050 is also included. The lithium-ion batteries have a round-trip efficiency of 96%.
The model is based on model.energy but without the hydrogen storage. It is optimised with free backup generation for the final 10/5/1% then the costs are added back on top. This allows the user to easily increase the investment or fuel cost for the backup, since this is the most uncertain part of the costing.
To reproduce the optimisation on model.energy, choose the point location in "Step 1". Then for the technologies in "Step 3", disable wind and hydrogen storage. Under "Advanced settings" enable the checkbox for "Dispatchable technology 1" and set both its overnight cost and marginal cost to zero. To get (100-x)% solar-battery coverage, i.e. limit the backup to x% coverage, put a dummy emissions factor of 100 gCO2/kWhel on the backup, and then activate the checkbox for the overall CO2 limit and set the allowed emissions to x gCO2/kWhel. The CO2 emissions limit is being used as a proxy for the overall backup fuel usage.
Once you have the optimisation result, you can add the backup costs separately. For example, if the solar-battery system on its own costs 50 €/MWh for (100-x)% coverage, where x=10,5,1, then you add for the backup per €/MWh (assuming enough backup capacity to cover the entire load):
investment cost * (annuity factor + FOM) / 8760 + fuel cost * x / efficiency
For the default back investment cost of 1 M€/MW, 25 year lifetime, 5% cost of capital, 3% yearly FOM, fuel cost of 30 €/MWhth, efficiency 50% you get
1e6 * (0.071 + 0.03) / 8760 + 30*(x/100)/0.5 = (11.5 + 0.6x) €/MWh
If the investment cost rises to 2 M€/MW, the fixed part rises from 11.5 €/MWh to 23 €/MWh.
For x=10 with the original settings, you get a total 17.5 €/MWh contribution from the backup.
If the fuel cost rises from 30 €/MWh to 50 €/MWh, the backup contribution rises to (11.5 + x) = 21.5 €/MWh.
The sensitivity of the total cost to the fuel cost is directly tied to x - the more solar and wind, the lower x and the less the fuel dependency becomes.
To supply the full demand with these assumptions with a fuel cost of 30 €/MWhth would cost (11.5 + 60) = 71.5 €/MWh, which is more expensive in most locations that the solar-battery-fuel system. However the cost of the backup fuel will vary by location based on availability. If it rises to 60 €/MWhth the full system costs would rise to (11.5 + 120) = 131.5 €/MWh.
The calculations are carried out for the 9196 1° by 1° pixels that contains more than 10,000 people, which is enough to include 99.86% of the population.
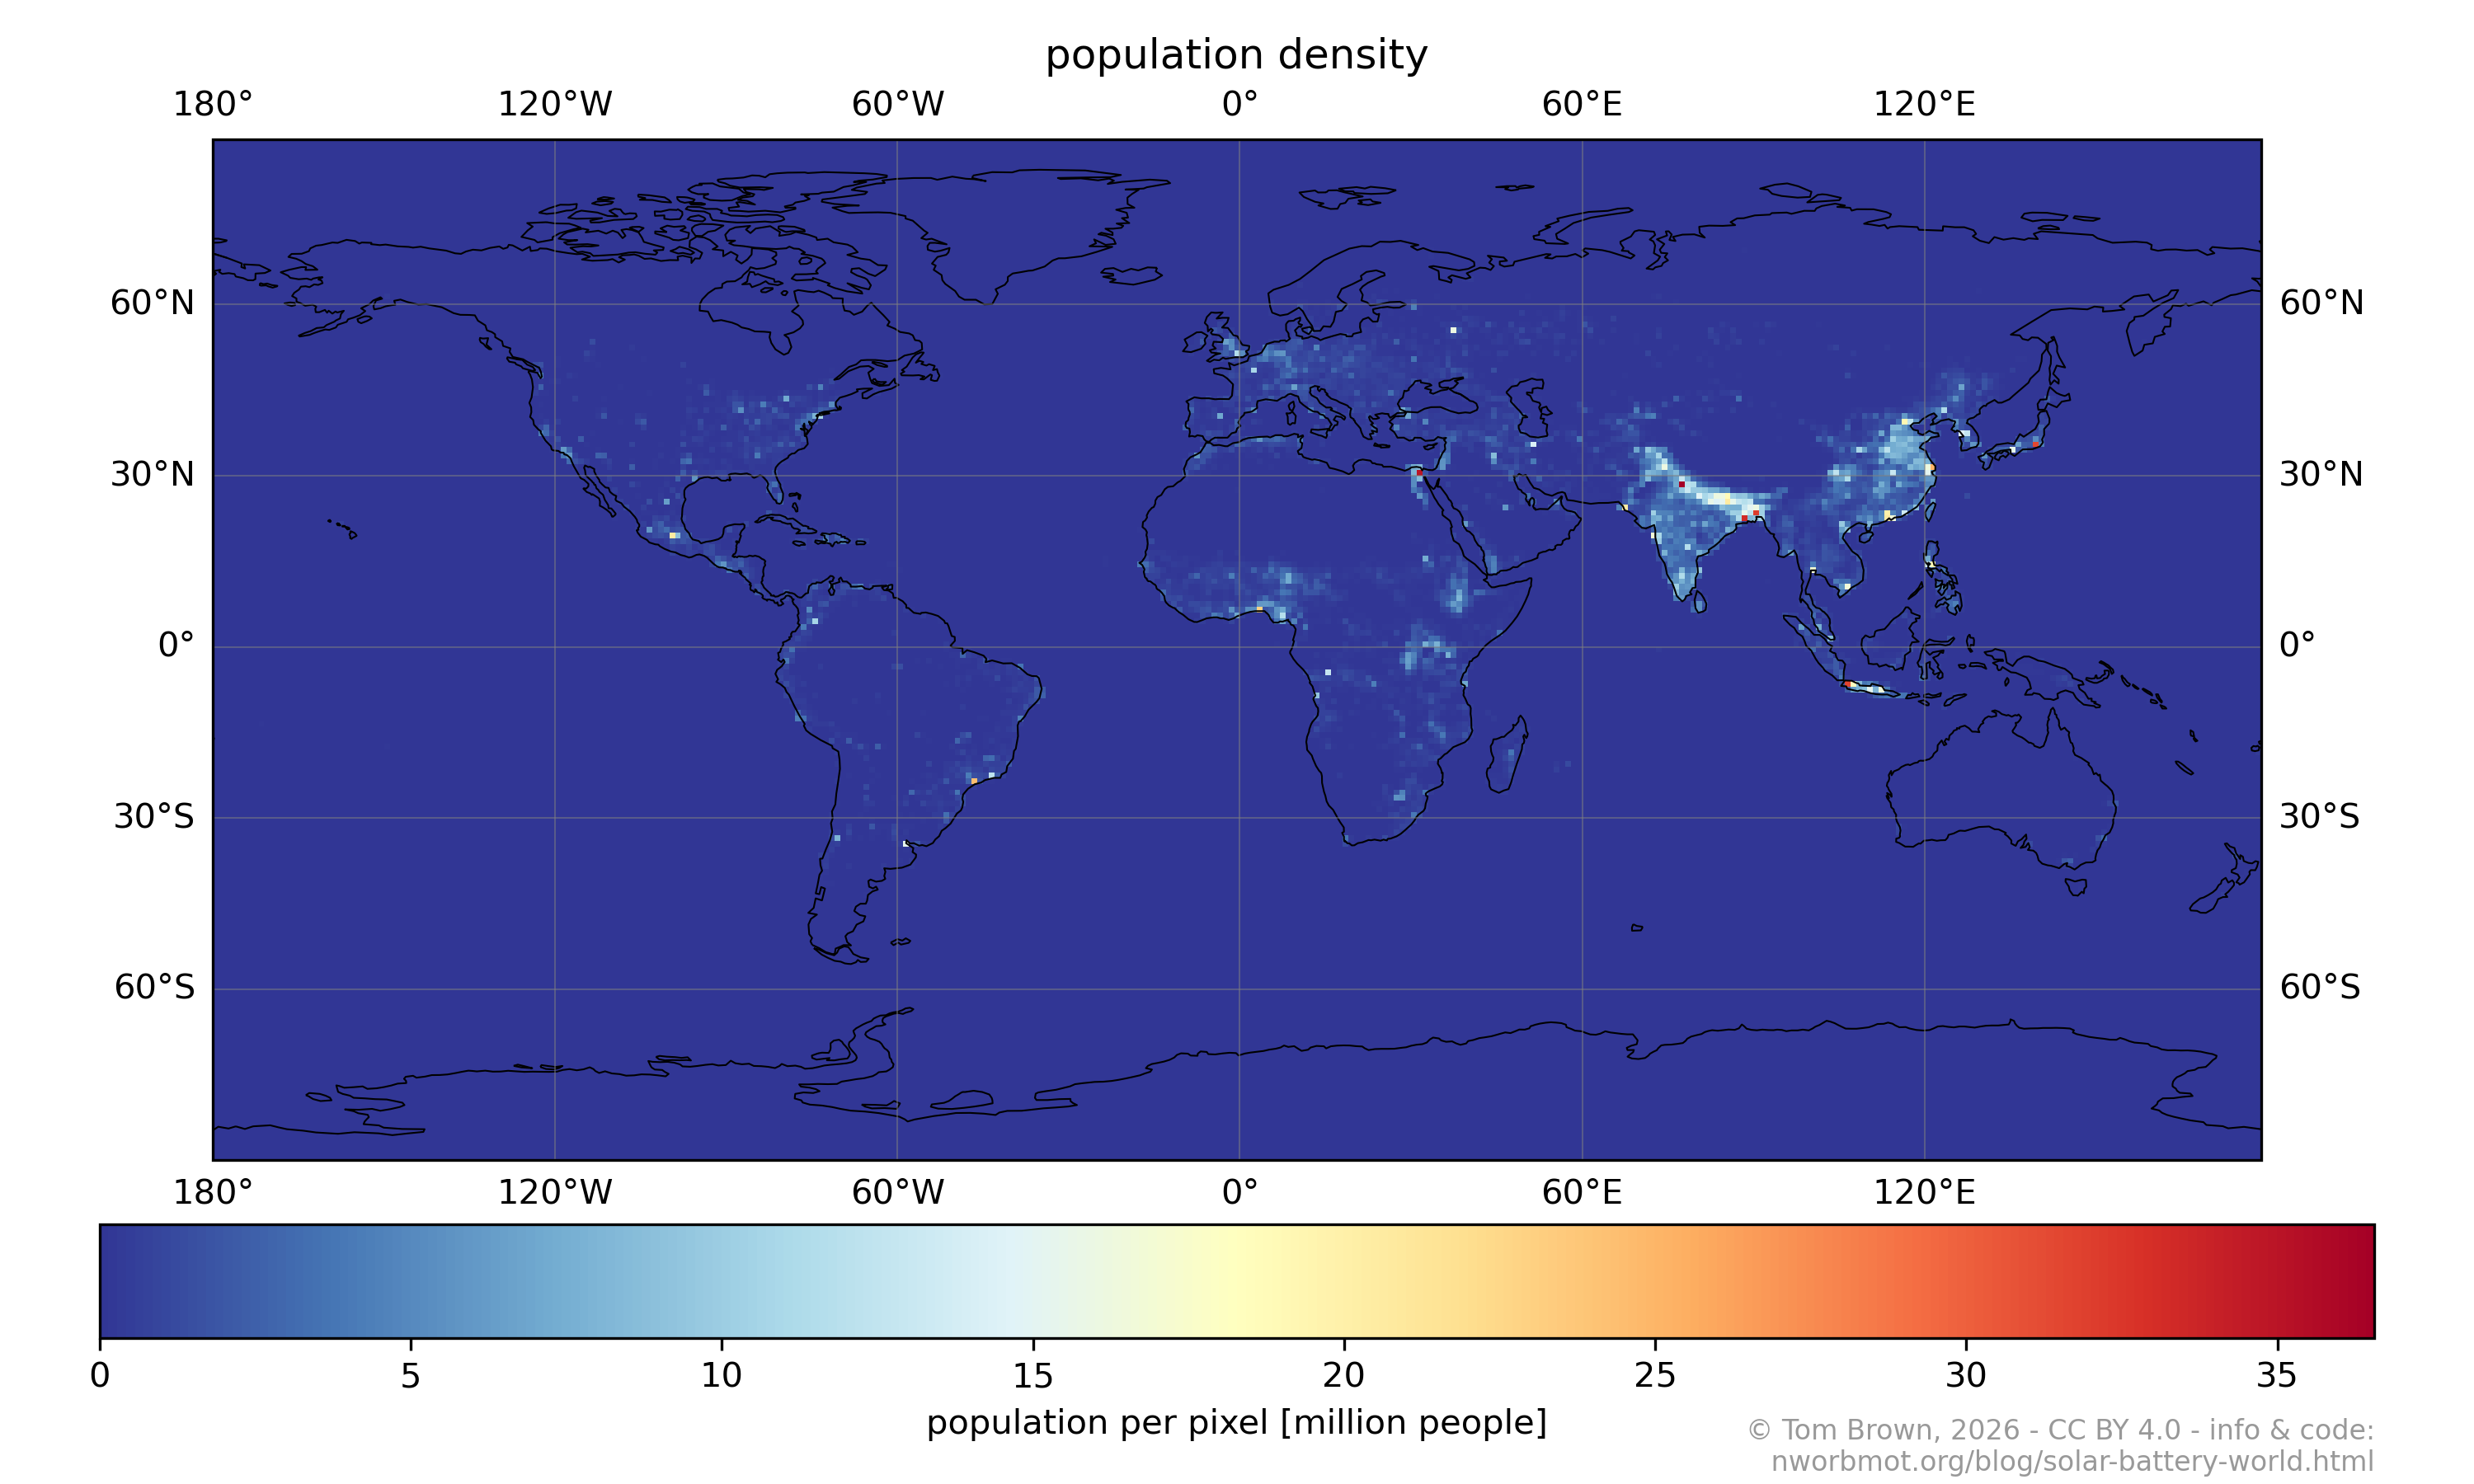
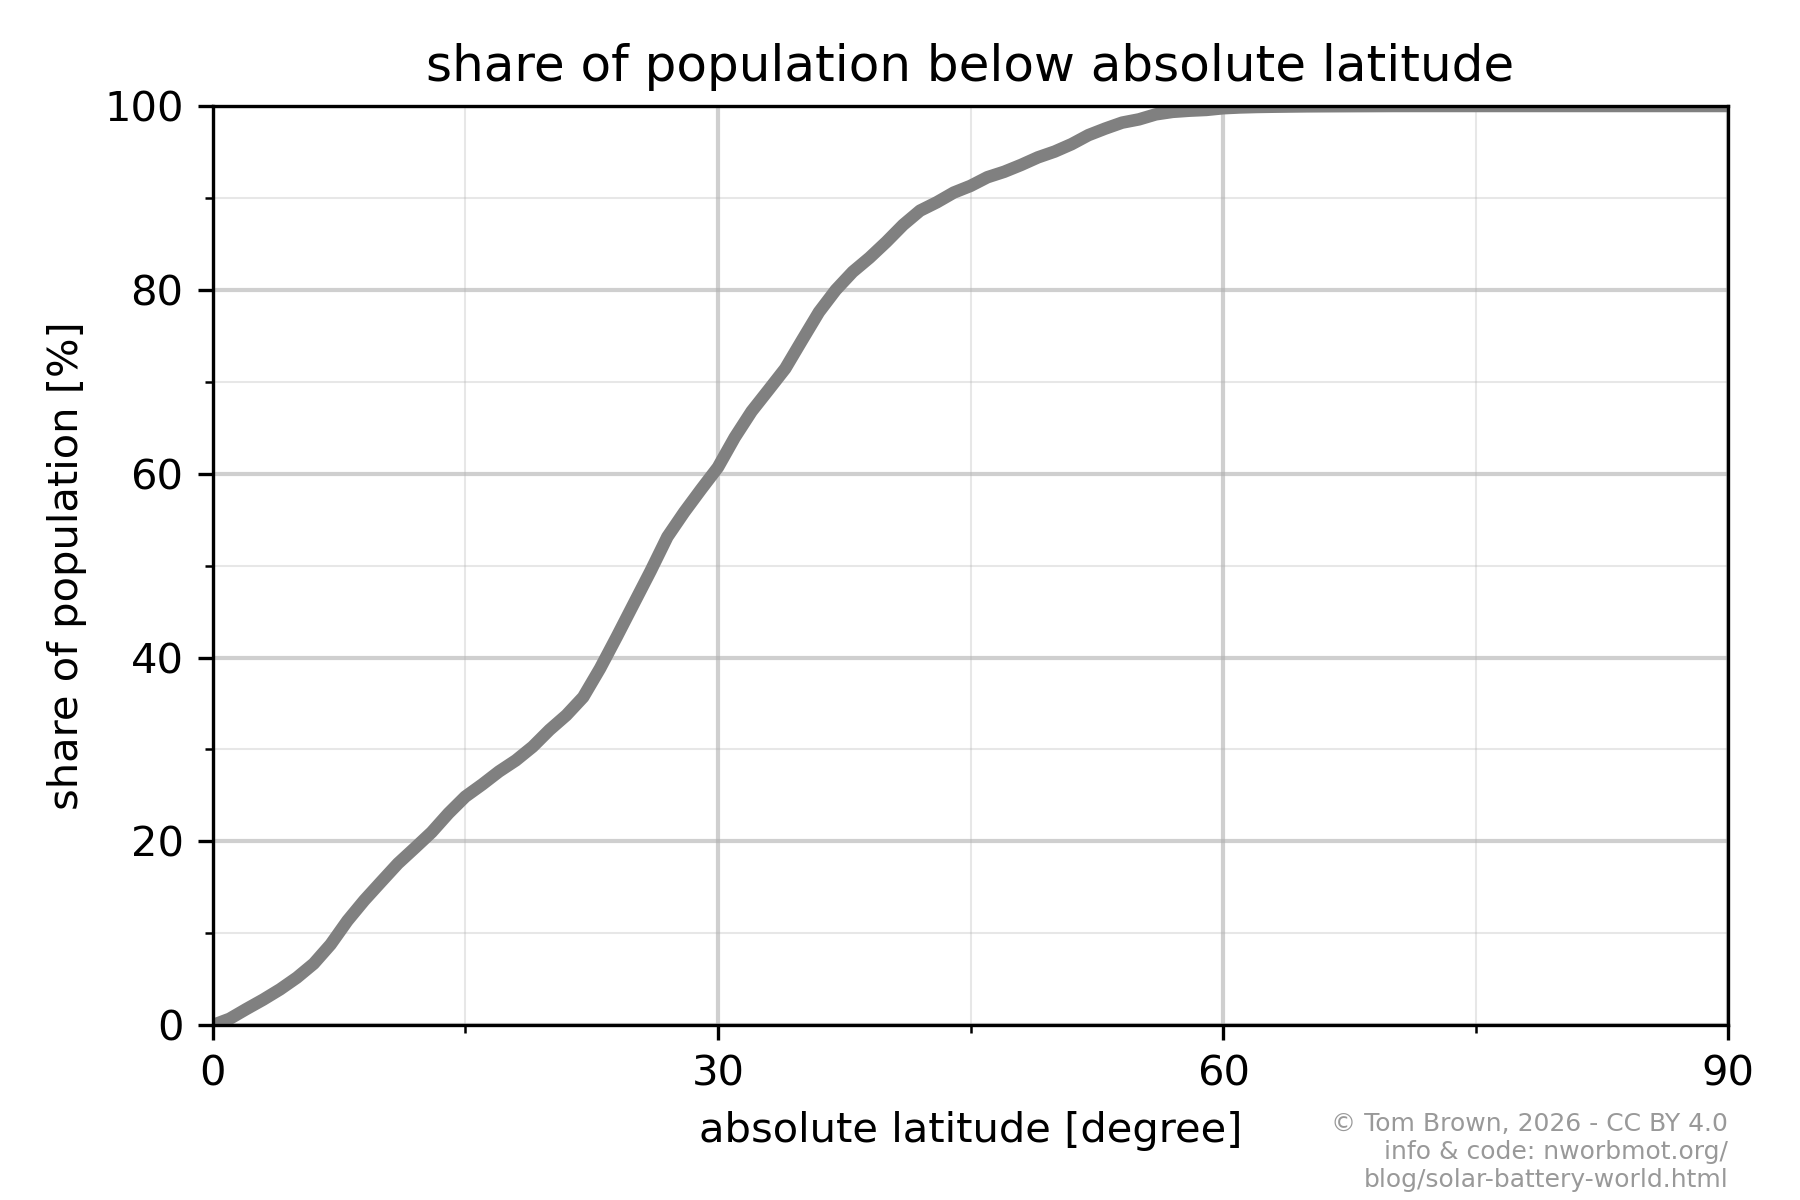
90% of the population lives within 45 degrees of the equator:
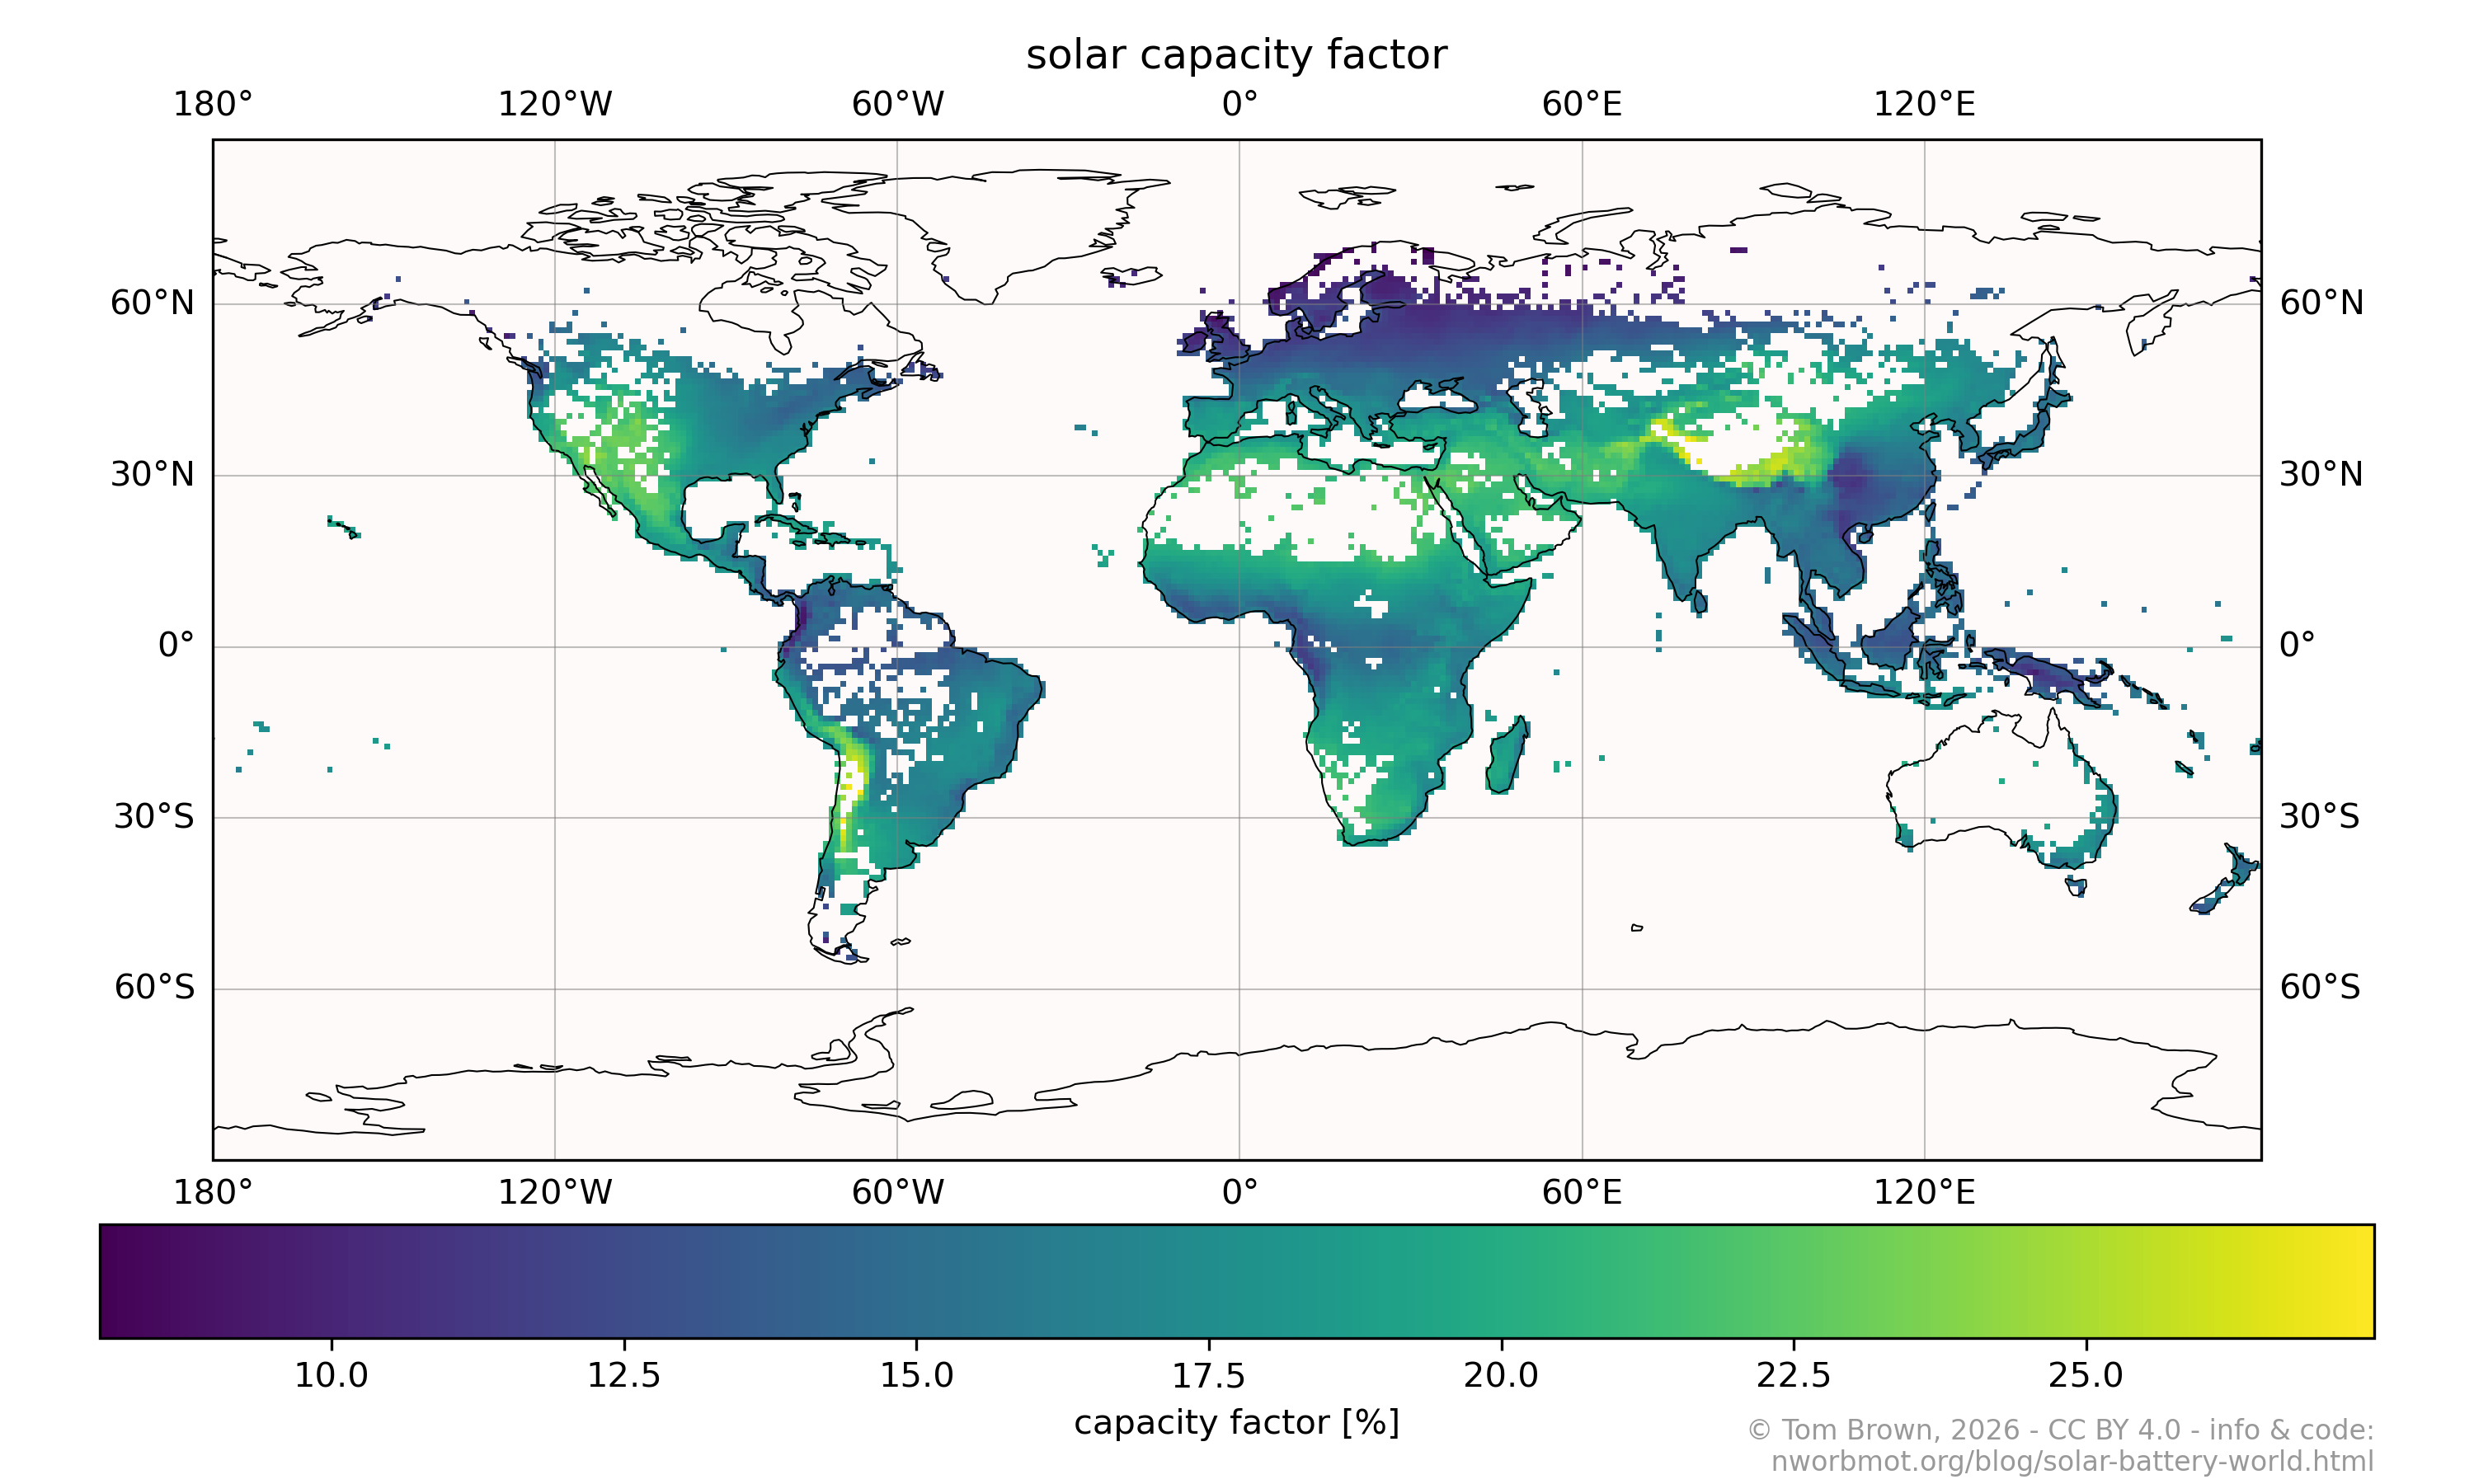
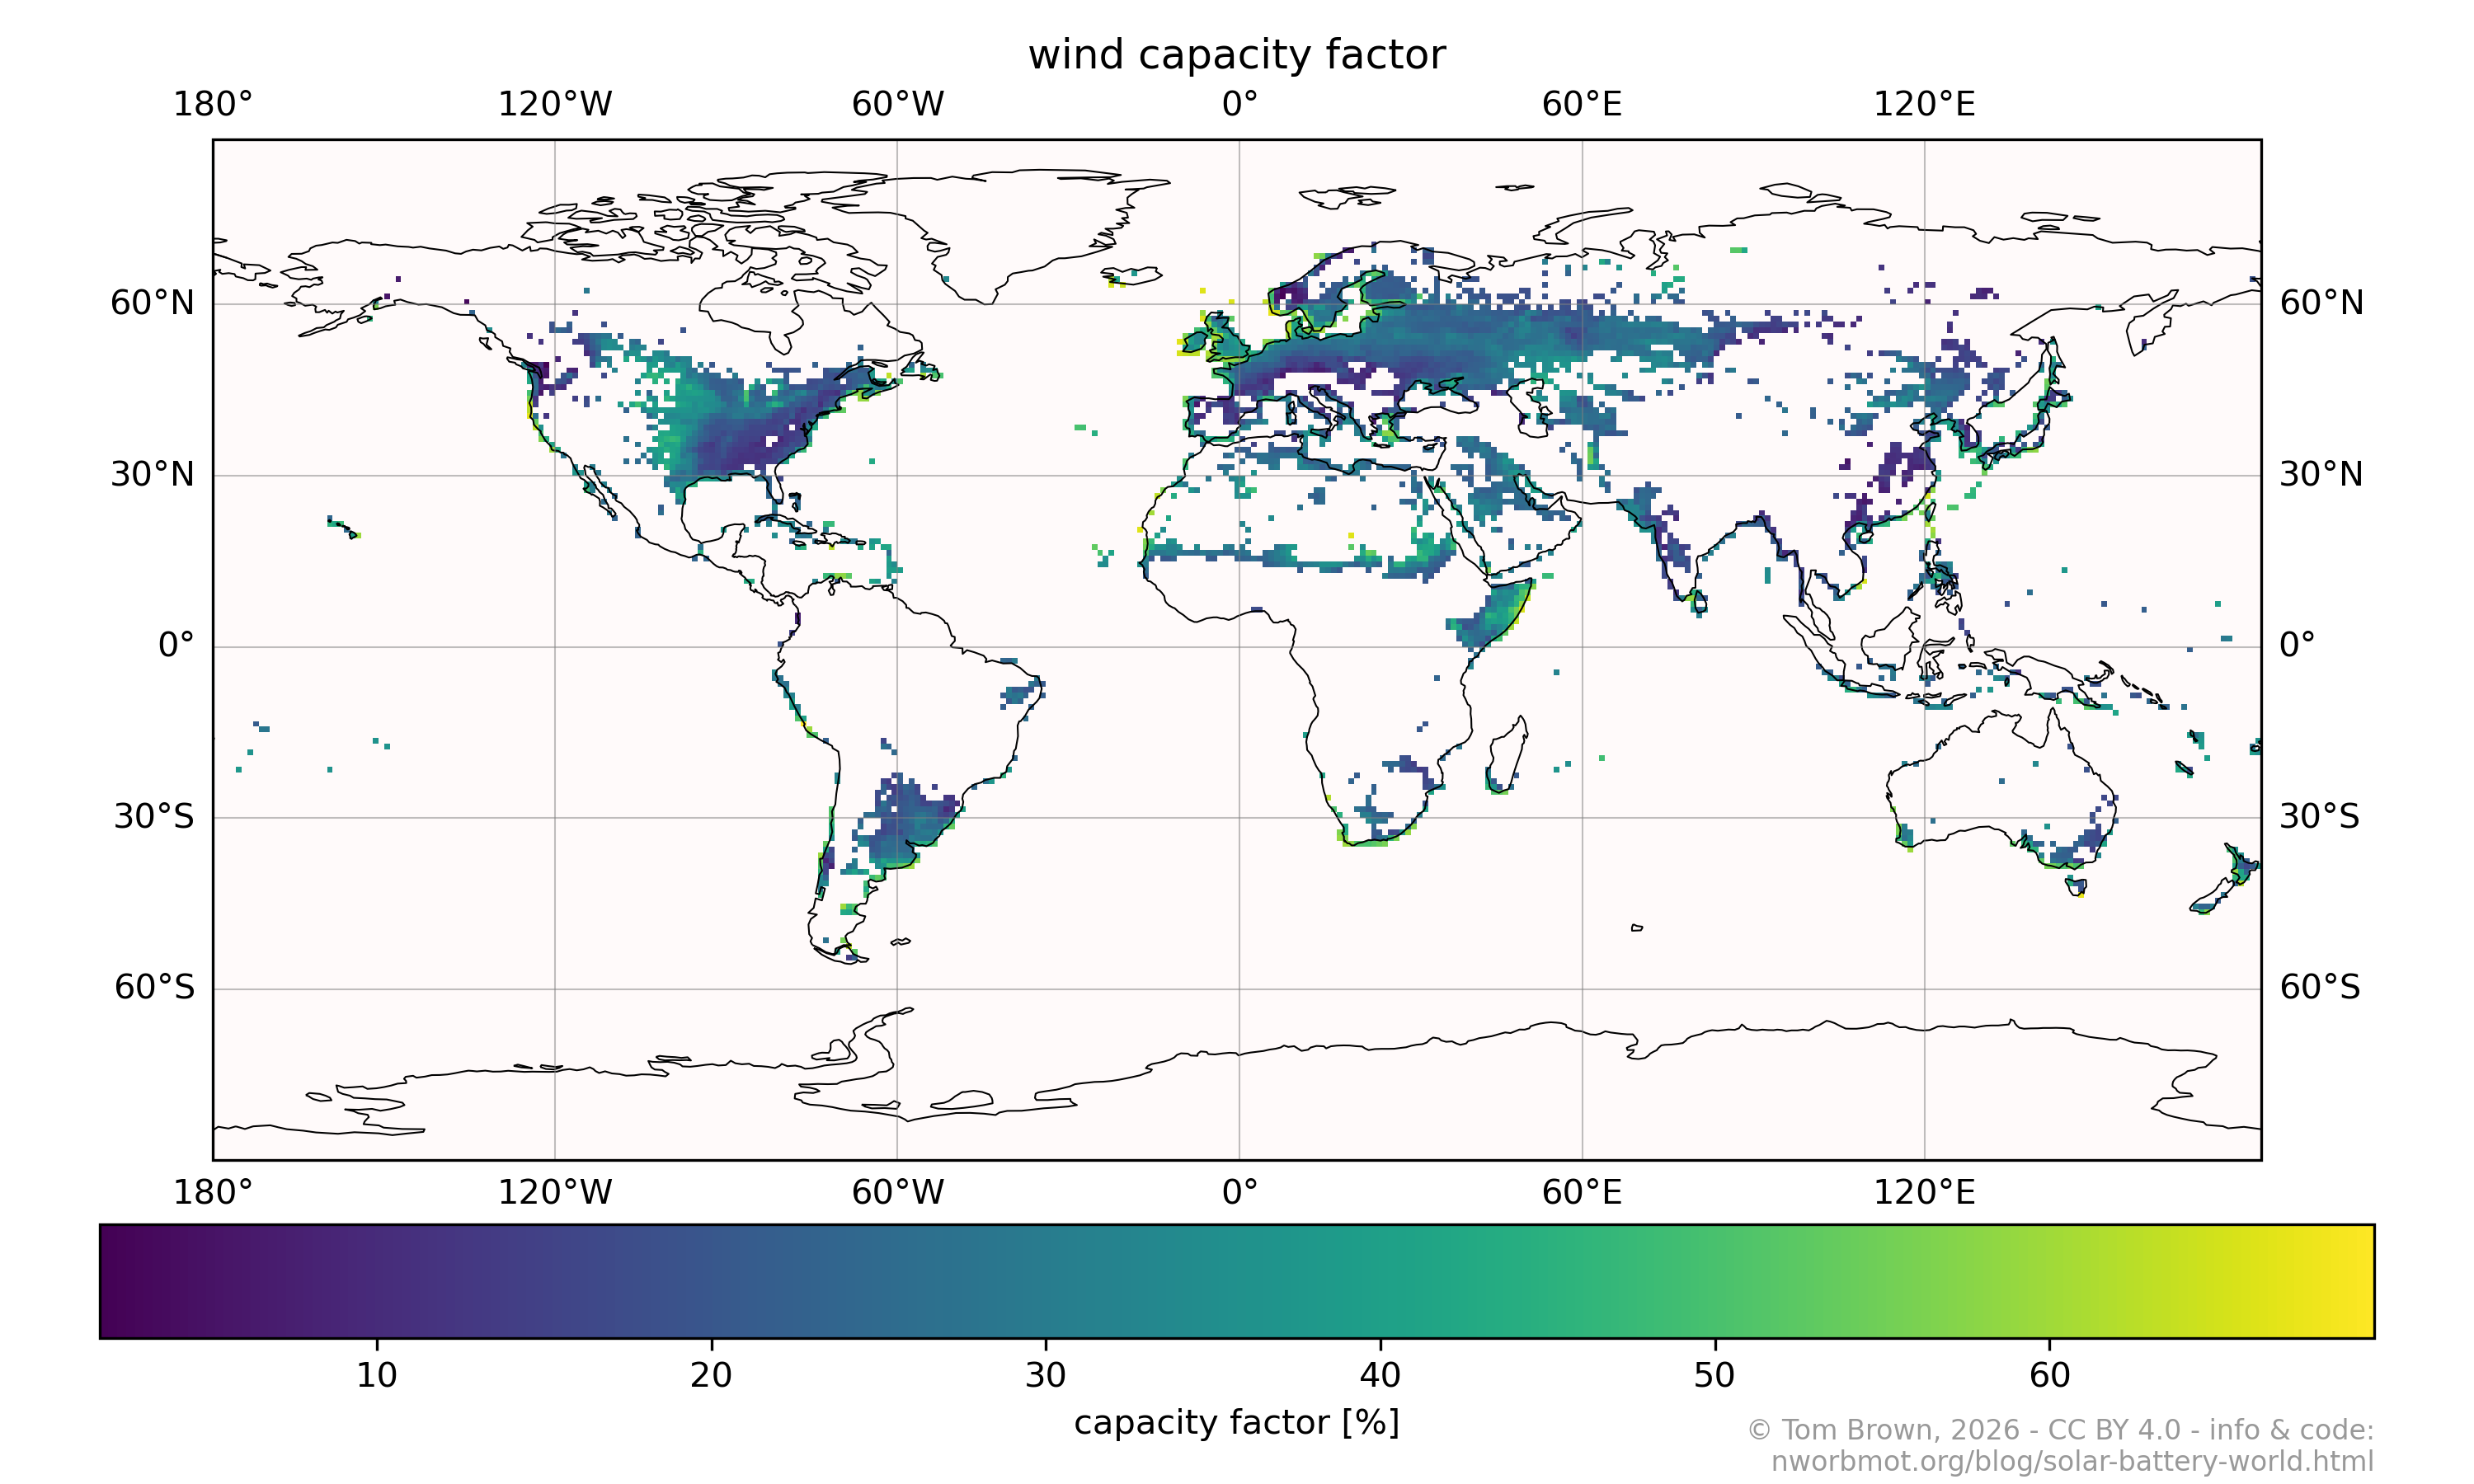
Here are the capacity factors (average production divided by capacity) for solar and wind, at the locations where they are built by the model:
The setup is somewhat similar to a 2025 Ember report, but whereas they fixed the solar and battery capacities relative to a constant demand, and varied the location, we fix instead the fraction of load supplied, and optimise the solar and battery capacities.
Victoria et al, 2021 also pointed out the coincidence of low seasonal solar variation and the locations where most of the population lives in this nice graphic:
Figure 1: Source: Victoria et al, 2021
2. Warnings
Many of the model.energy warnings also apply here.
- The demand is flat, so doesn't account for seasonal variability in demand. Cooling demand aligns well with solar insolation. However, seasonal heating demand can be a challenge for solar-based systems. For high latitudes in the North, the wind is stronger in the winter, which raises the value of including wind.
- The more technologies we include, the cheaper the supply cost can become. In particular more storage technologies, wind, existing hydro and other low-carbon sources can decrease costs while keeping emissions low.
- The results are quite sensitive to battery costs, so further cost reductions here could bring the system costs down further. See results with lower battery costs.
- The results are based on today's population distribution. Since population is growing faster at lower latitudes, the fraction of the population with low cost will only increase.
- Electricity demand doesn't necessarily follow population demand. Data centres and other electricity-intensive industries may relocate to cheaper locations.
- Including demand response, such as from battery electric vehicles, can further reduce costs.
- Connecting regions can also spread balancing costs, particularly for wind-heavy systems, but with the added expense of building the necessary grid infrastructure.
- General grid costs were not included here beyond 50 €/kW to connect the solar, because in principle these utility-scale systems could be implemented locally if there is space, and distribution costs will vary from region to region.
- The solar panels have a fixed tilt of 35 degrees towards the equator. Axis-tracking could lower costs.
- The cost assumptions assume utility-scale solar panels and batteries in large parks. Smaller-scale rooftop solar and home batteries would cost 2-3 times more.
- There may not be sufficient land near densely-populated areas. This may require supply from further away. More discussion on land use can be found below.
- The solar insolation is based on reanalysis data from the European Centre for Medium-Range Weather Forecasts (ECMWF) ERA5 dataset and is processed using the atlite library. Reanalysis data is sometimes imperfect.
- The costs are given in 2020 euros; in 2026 euros the costs will be around 20-25% higher. This needs to be set against the conservative cost projections for 2030, particularly for batteries, whose costs are dropping fast.
- The backup fuel is costed for fossil gas at 30 €/MWhth. This excludes any externalities, such as climate damages or energy insecurity. Priced at 300 €/tCO2 (the German Environmental Agency (UBA) social cost of carbon (SCC)), the climate damage externality would add 60 €/MWhth. Due to the US-Israeli attack on Iran in 2026, the fossil gas price rose in March 2026 to 50-60 €/MWhth. These higher fuel prices could make higher shares of solar and batteries, e.g. 99%, cost less than shares of 90%.
The cost of capital, assumed to be 5% in all regions, will vary depending on the region. Here is the spread of weighted average cost of capital (WACC) from 2024 (IRENA, 2025). Particularly in Africa, this will raise the system costs.
Figure 2: Source: IRENA, 2025
3. Open code and data
All code on which these calculations are based is available with an open licence:
https://github.com/nworbmot/solar-battery-world
Outputs from the scenarios are also available with an open licence:
4. Land and material use
Some rough calculations are provided here.
Assuming most energy demand electrifies and living standards equalise worldwide, each person would consume annually around 10 MWhel/a/person.
This gives worldwide electricity demand for 8 billion people of 80,000 TWhel/a.
The 90% solar-battery supply would require then 69 TWp of solar and 72 TWh of batteries in 2050.
70 TWp at 50 MWp/km2 covers 1,400,000 km2, around 1% of total land and 3.7% of land used for livestock:
Figure 3: Source: Our World in Data by Ritchie and Roser, 2023
But locally in densely-populated areas there may not be sufficient land, requiring the grid to transport it from neighbouring regions.
The factory capacity to produce solar PV is today just over 1 TWp/a, much of which is in China (Ember, 2024).
The IEA predicts close to 7 TWh/a manufacturing capacity for lithium ion batteries by 2030, mainly for electric vehicles (IEA, 2023).
The mining needs for renewable technologies are substantially lower than for fossil fuels (Ritchie, Our World in Data, 2024).
For solar PV, silicon is not scarce. The small silver requirement for the cell contacts dropped sevenfold (per W) from 2005 to 2020 and can be substituted by copper and aluminium (Victoria et al, 2021). Recycling can extract much of the used materials.
In batteries, many of the scarce materials are substitutable with less rare ones. Cobalt-containing cathodes can be replaced with lithium-iron-phosphate (LFP); graphite anodes can be partially replaced with silicon; looking at the whole battery, sodium-ion batteries can substitute for lithium-ion ones, particular for stationary applications where weight and bulk are not an issue (Yao et al, 2025).
5. Additional results
5.1. Population density versus system cost in one plot
Most of the population lives within 45 degrees of the equator. In this region, the cost of solar-battery systems remains low and doesn't need to be supplemented with wind. Above 45 degrees, wind helps to keep down system costs.
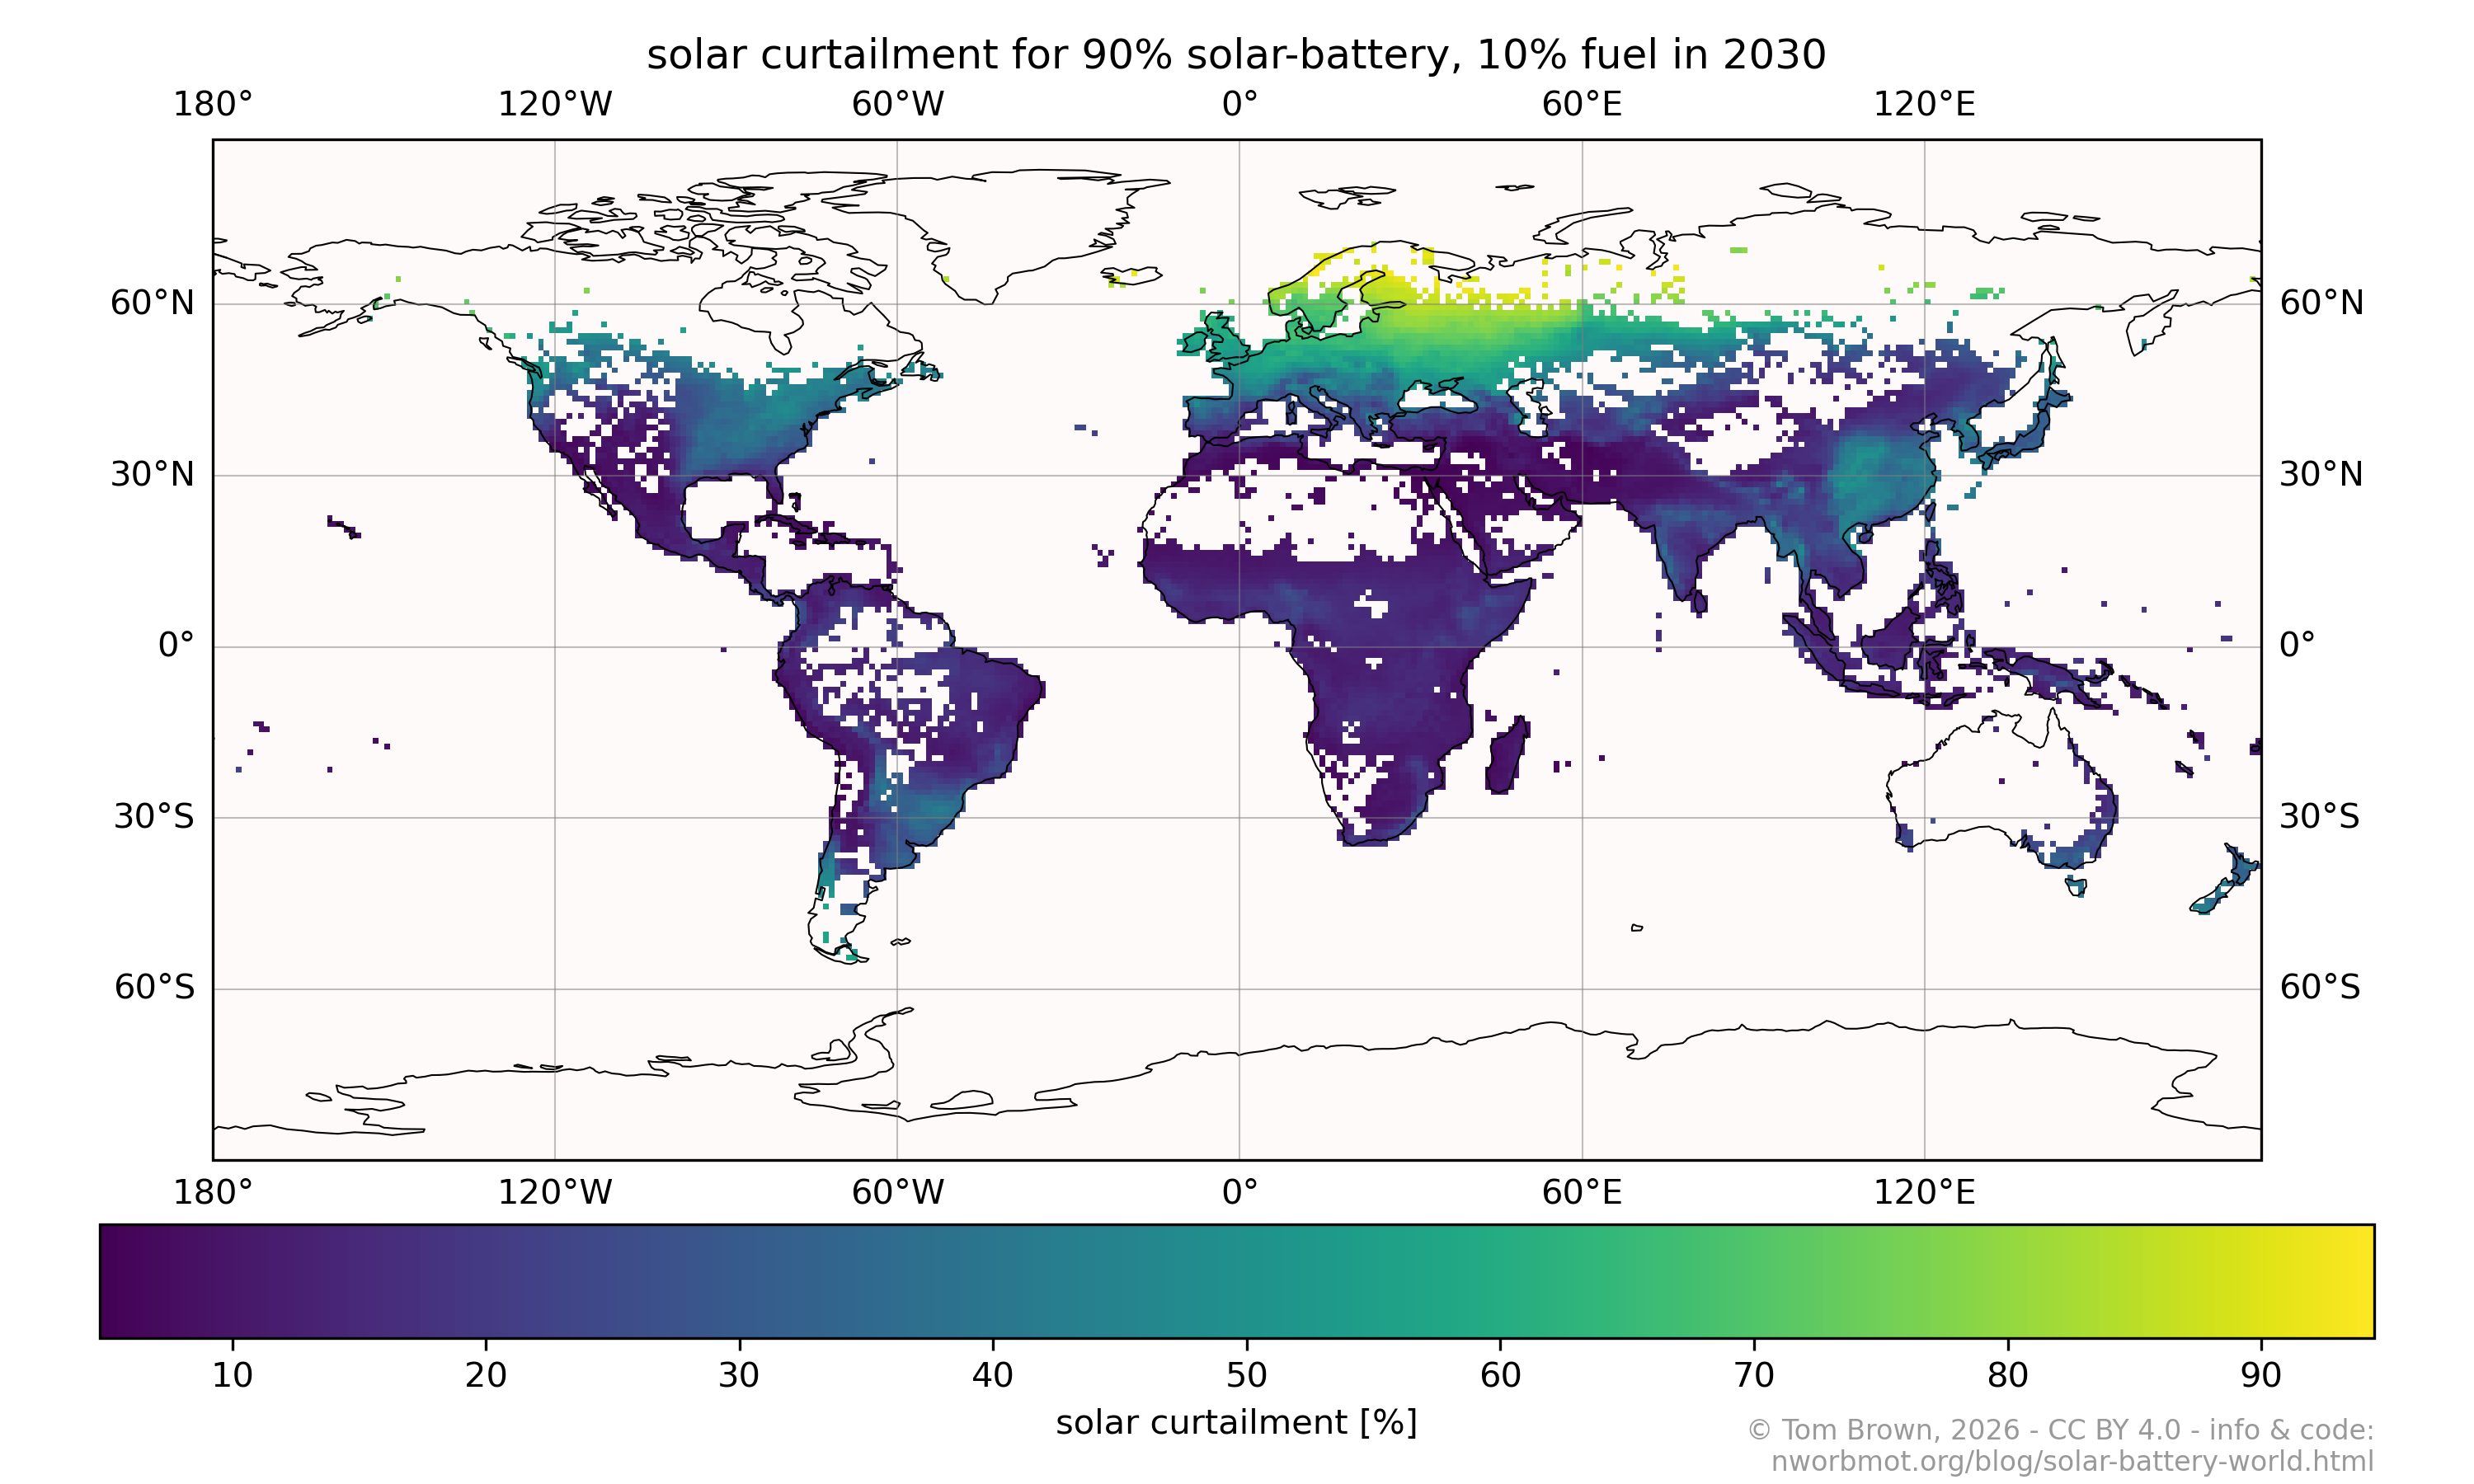
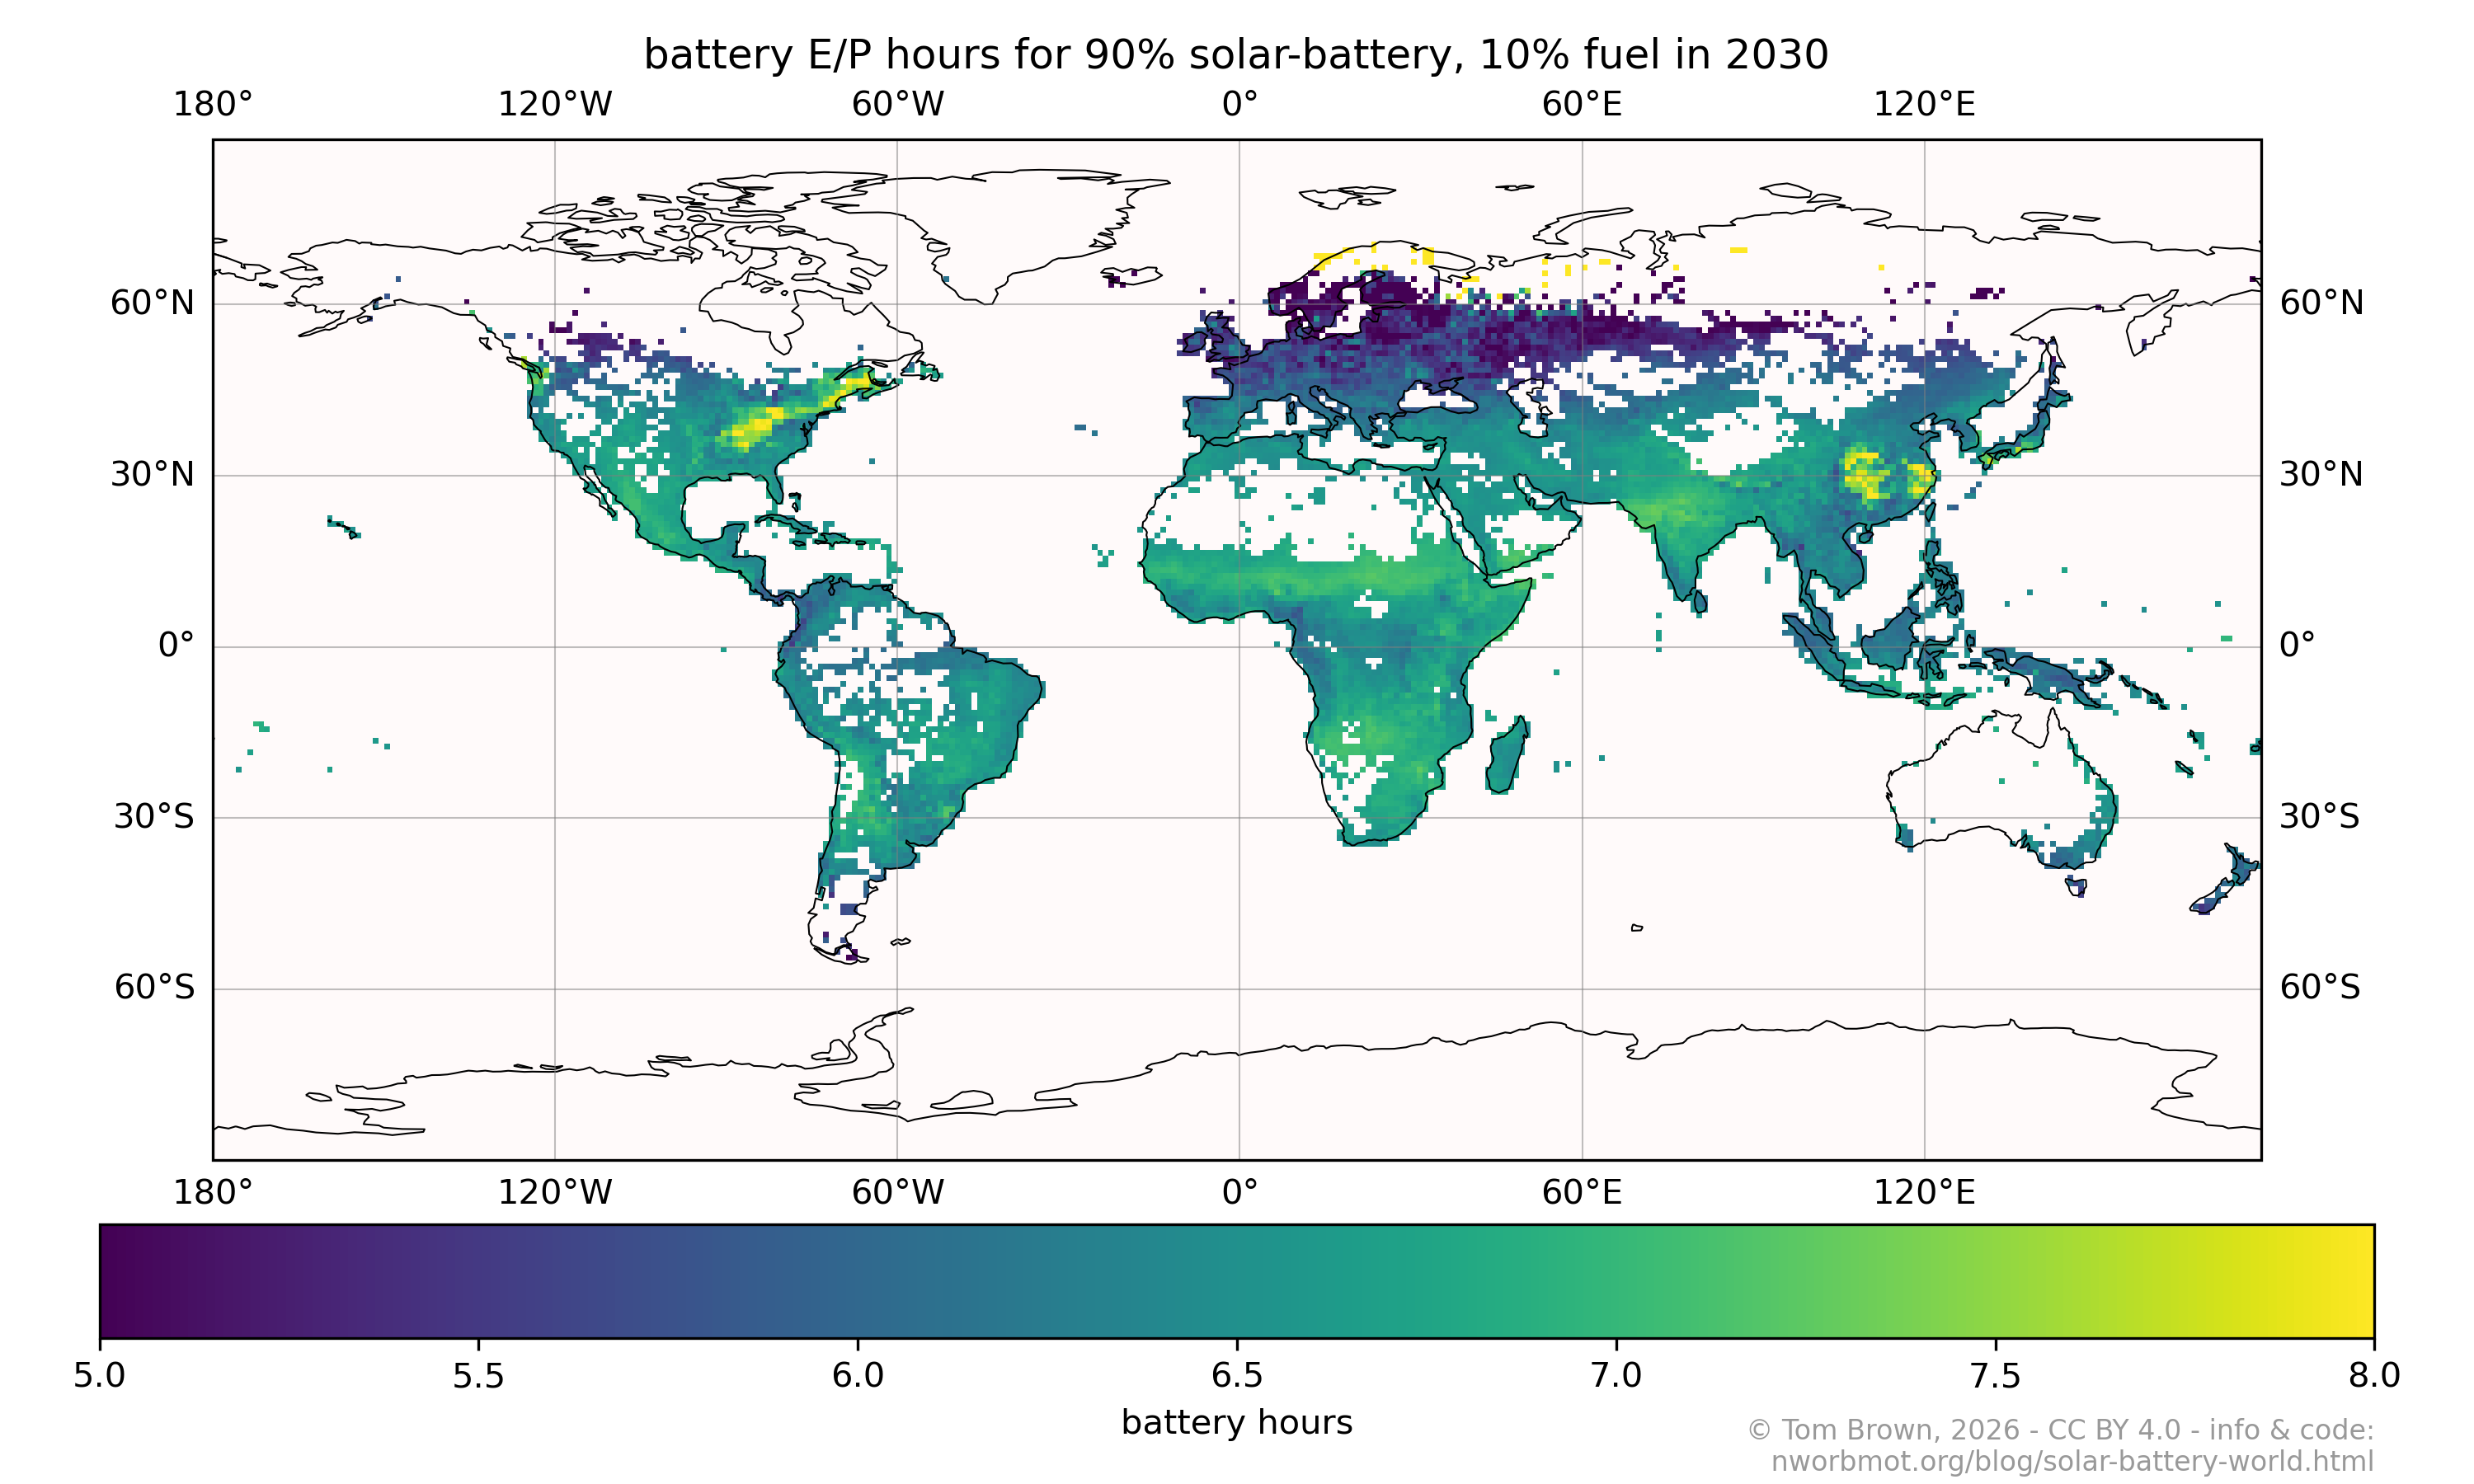
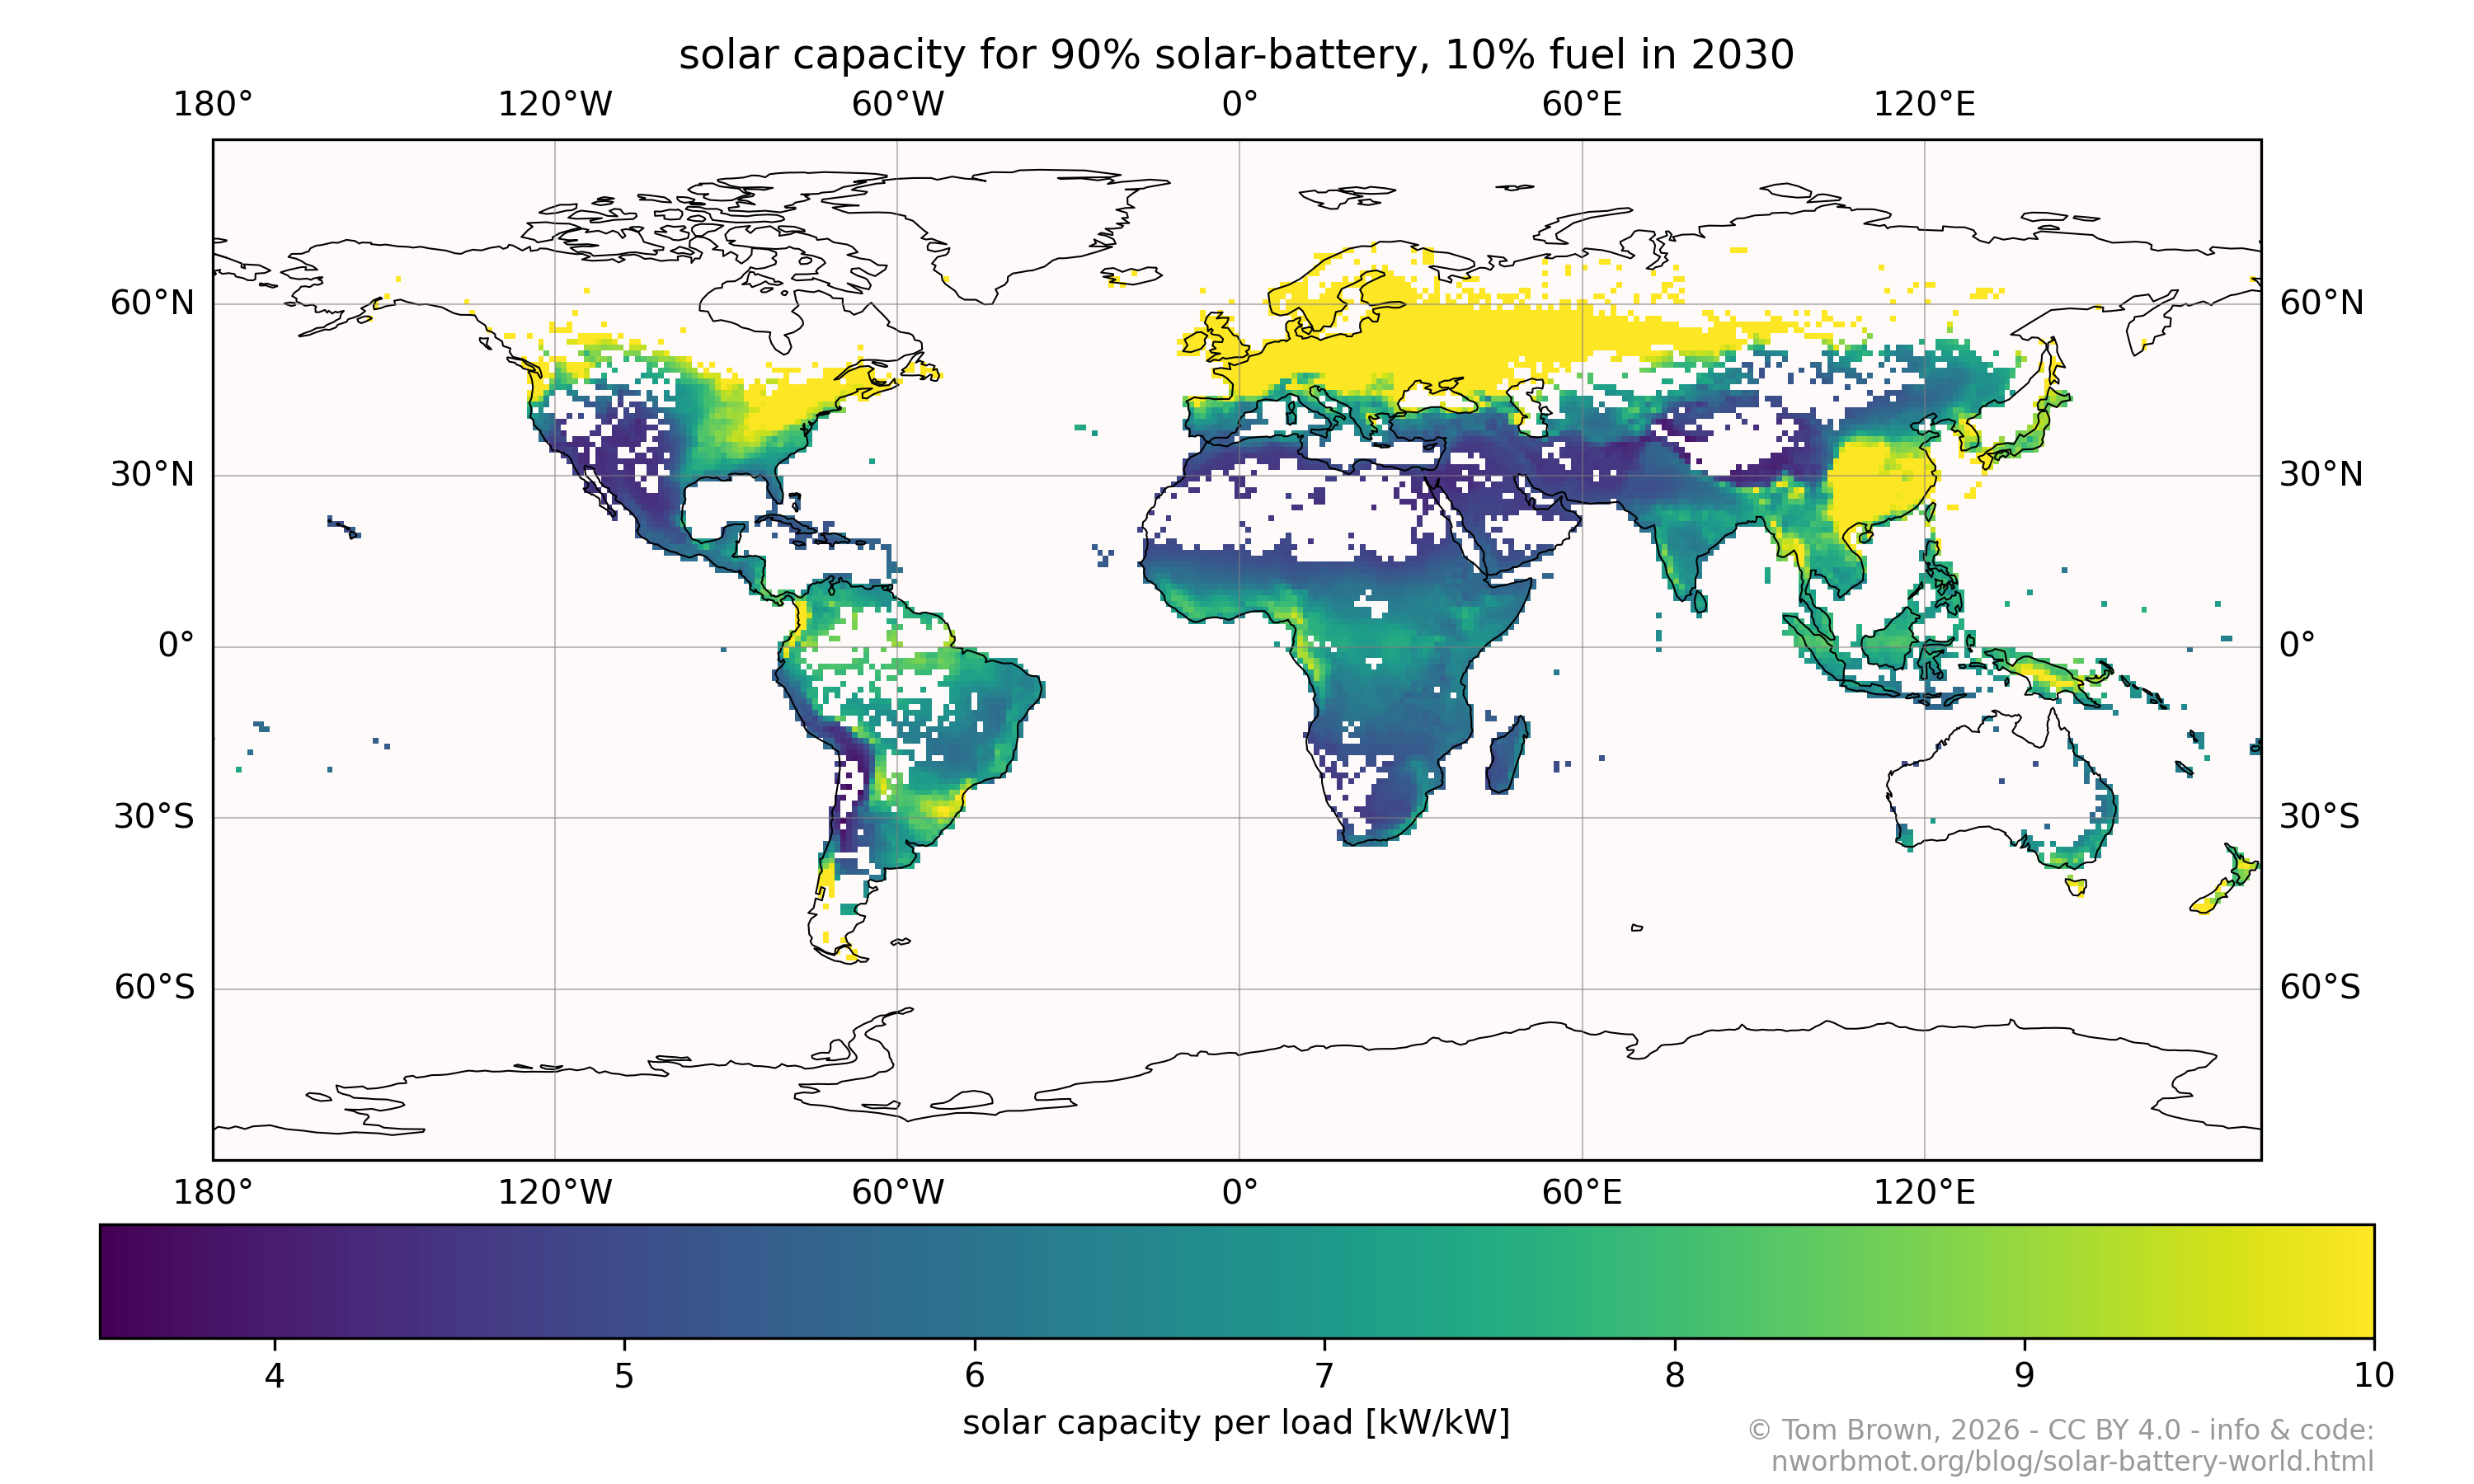
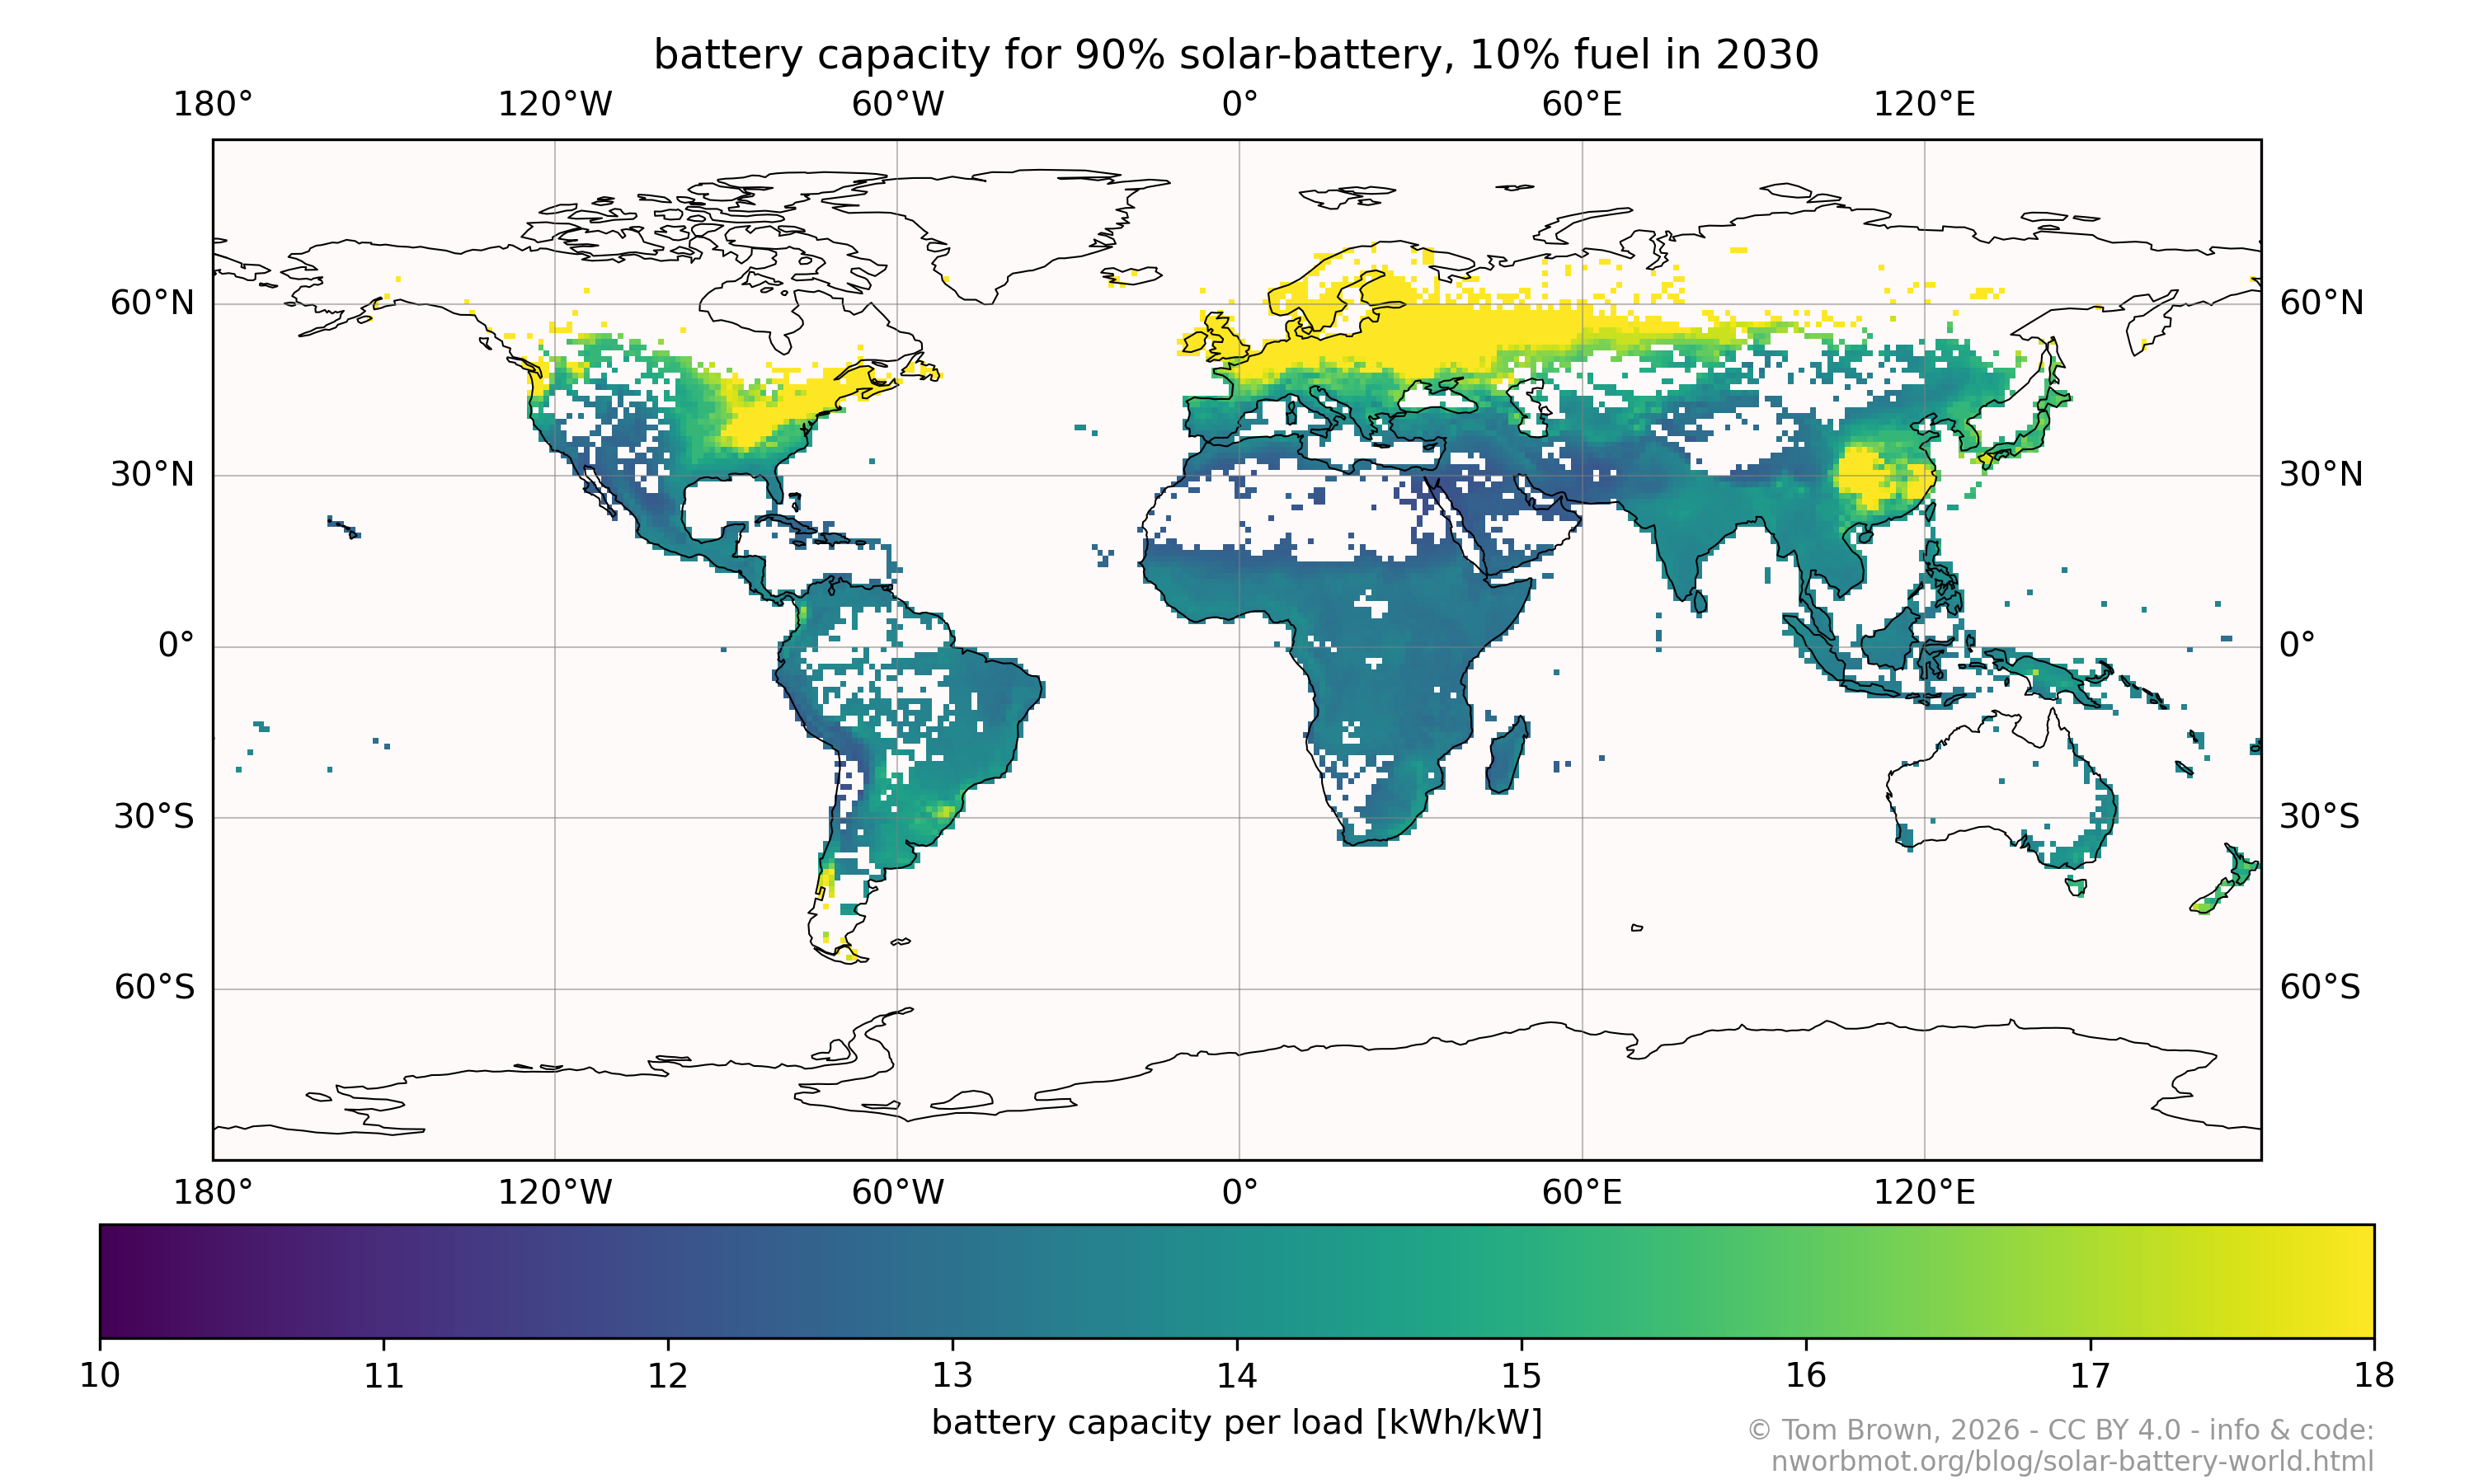
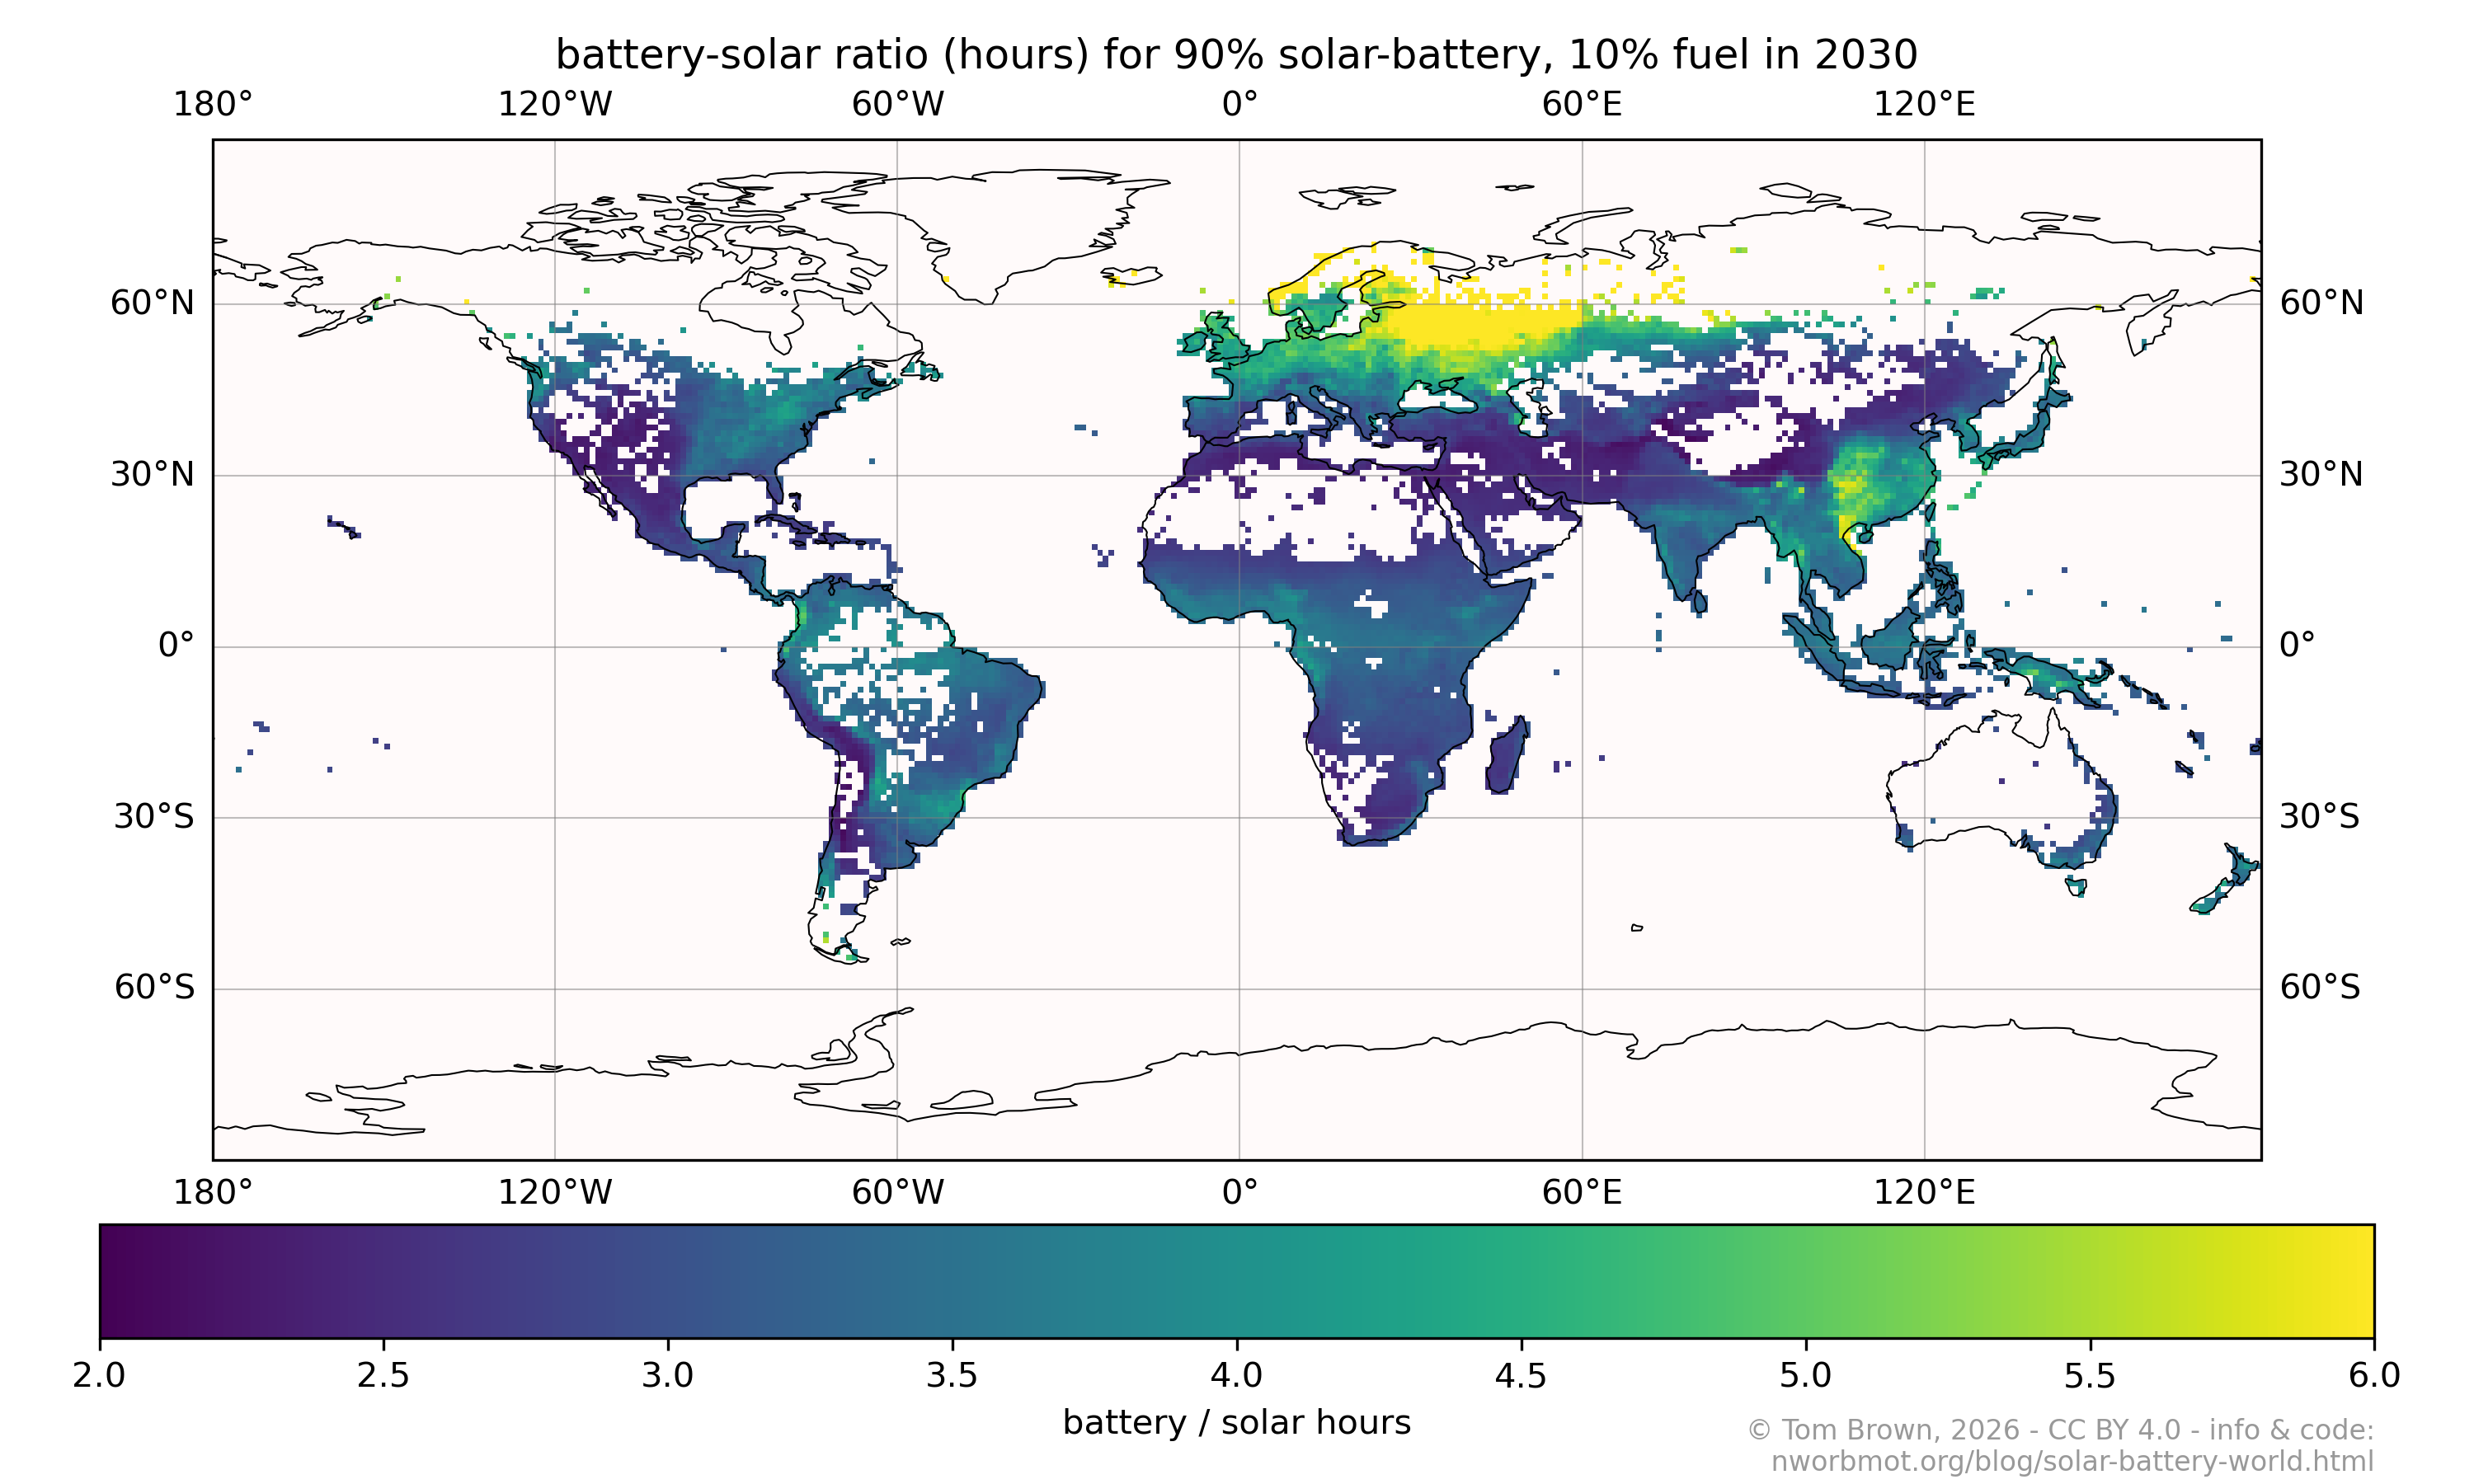
5.2. Additional plots for main 90% solar-battery scenario
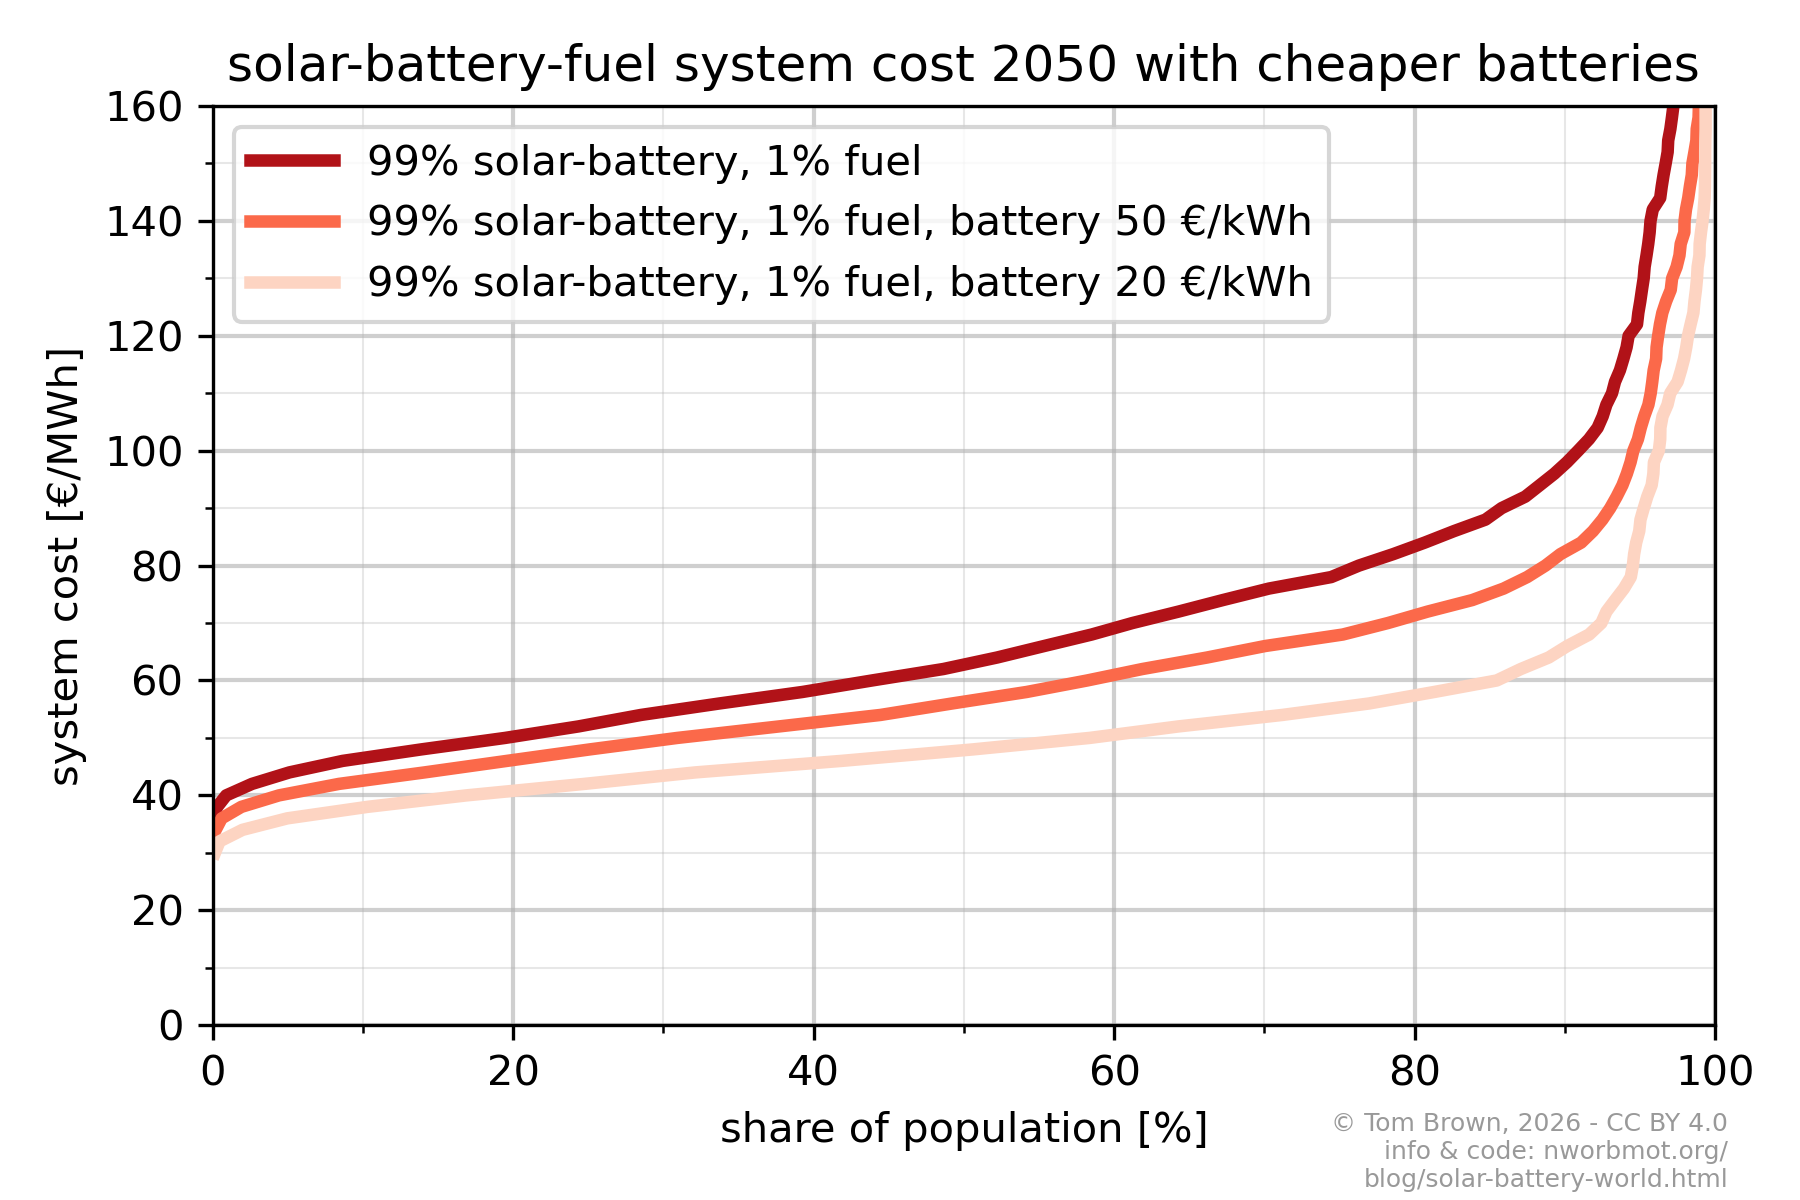
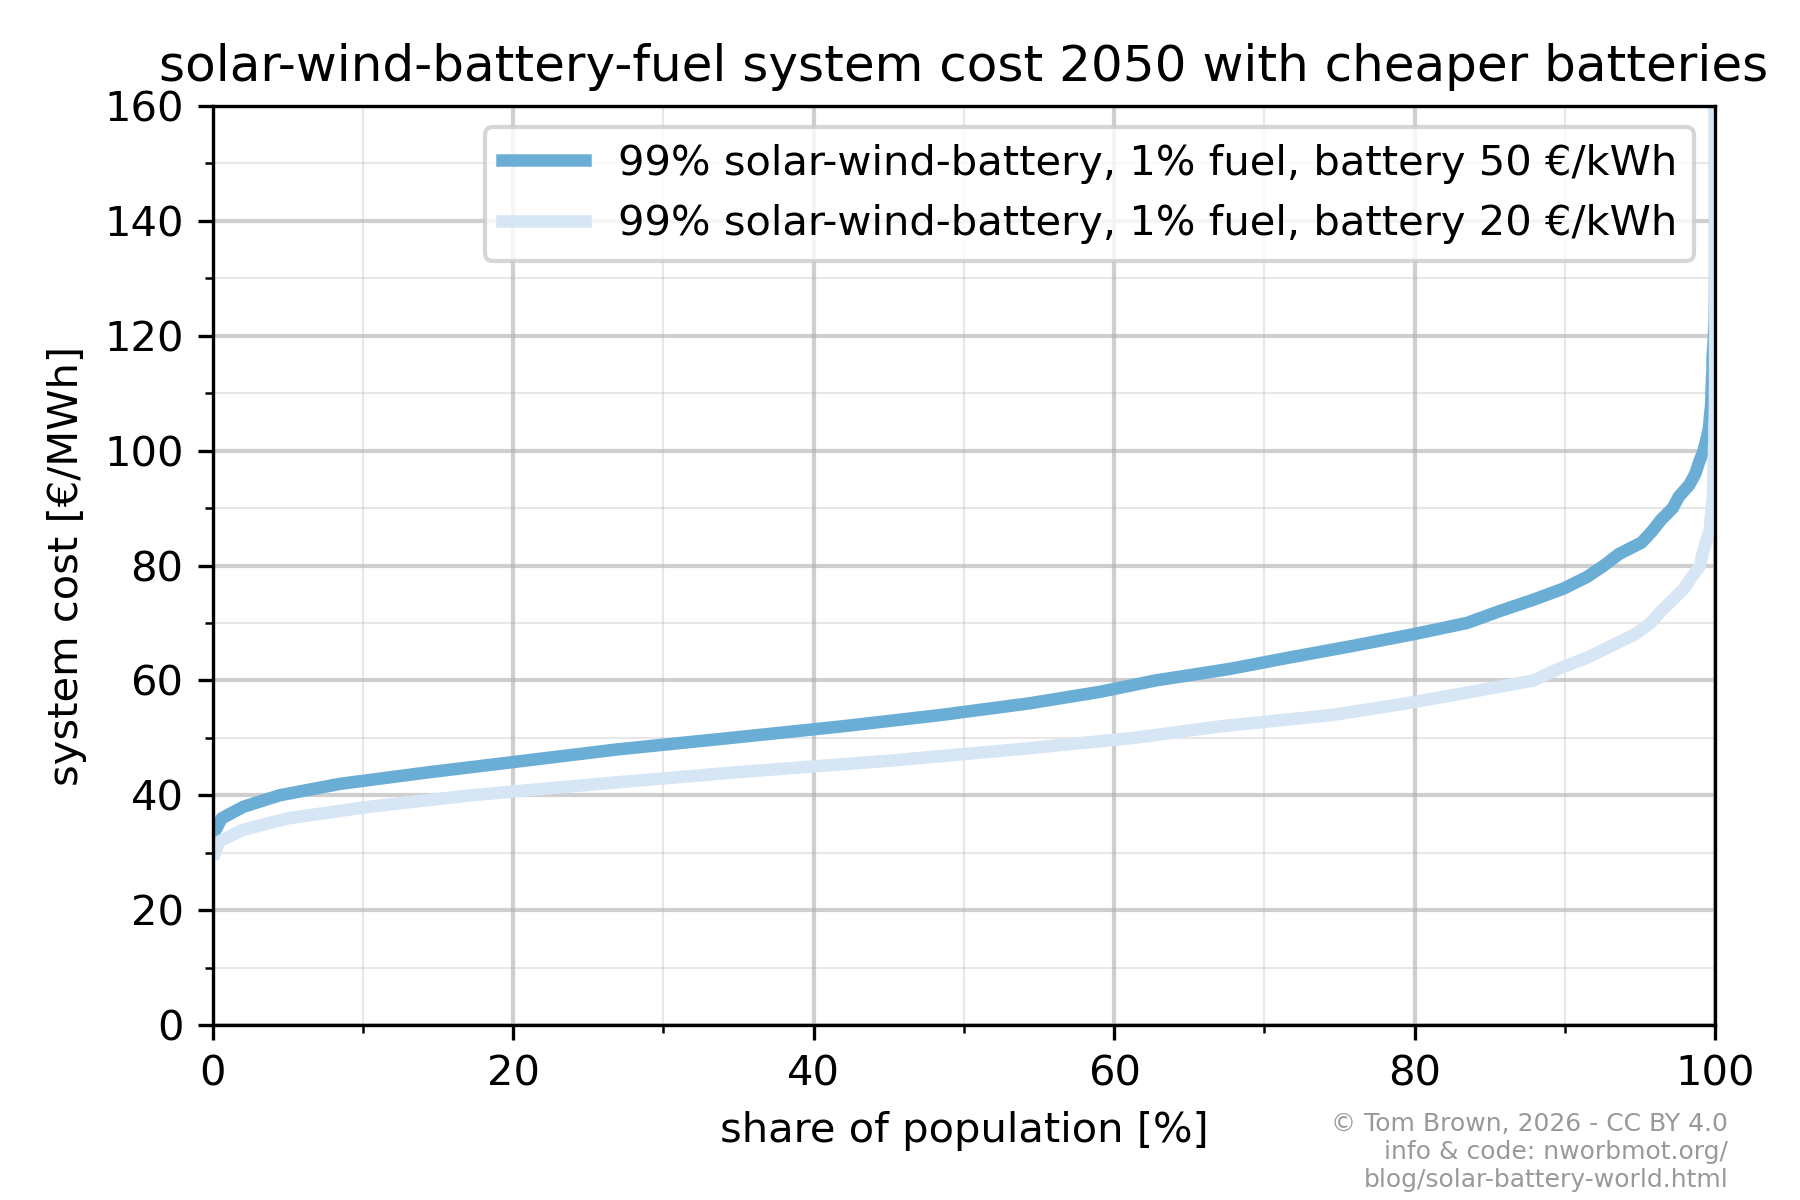
5.3. 2050 results with battery investment cost reduced from 83 to 50 and 20 €/kWh
The default battery installed cost assumption for 2050 is 83 €/kWh. Utility-scale sodium-ion batteries could drop to 29-52 €/kWh according to Keiner et al, 2025, so we also provide here some simulations with lower-cost batteries.
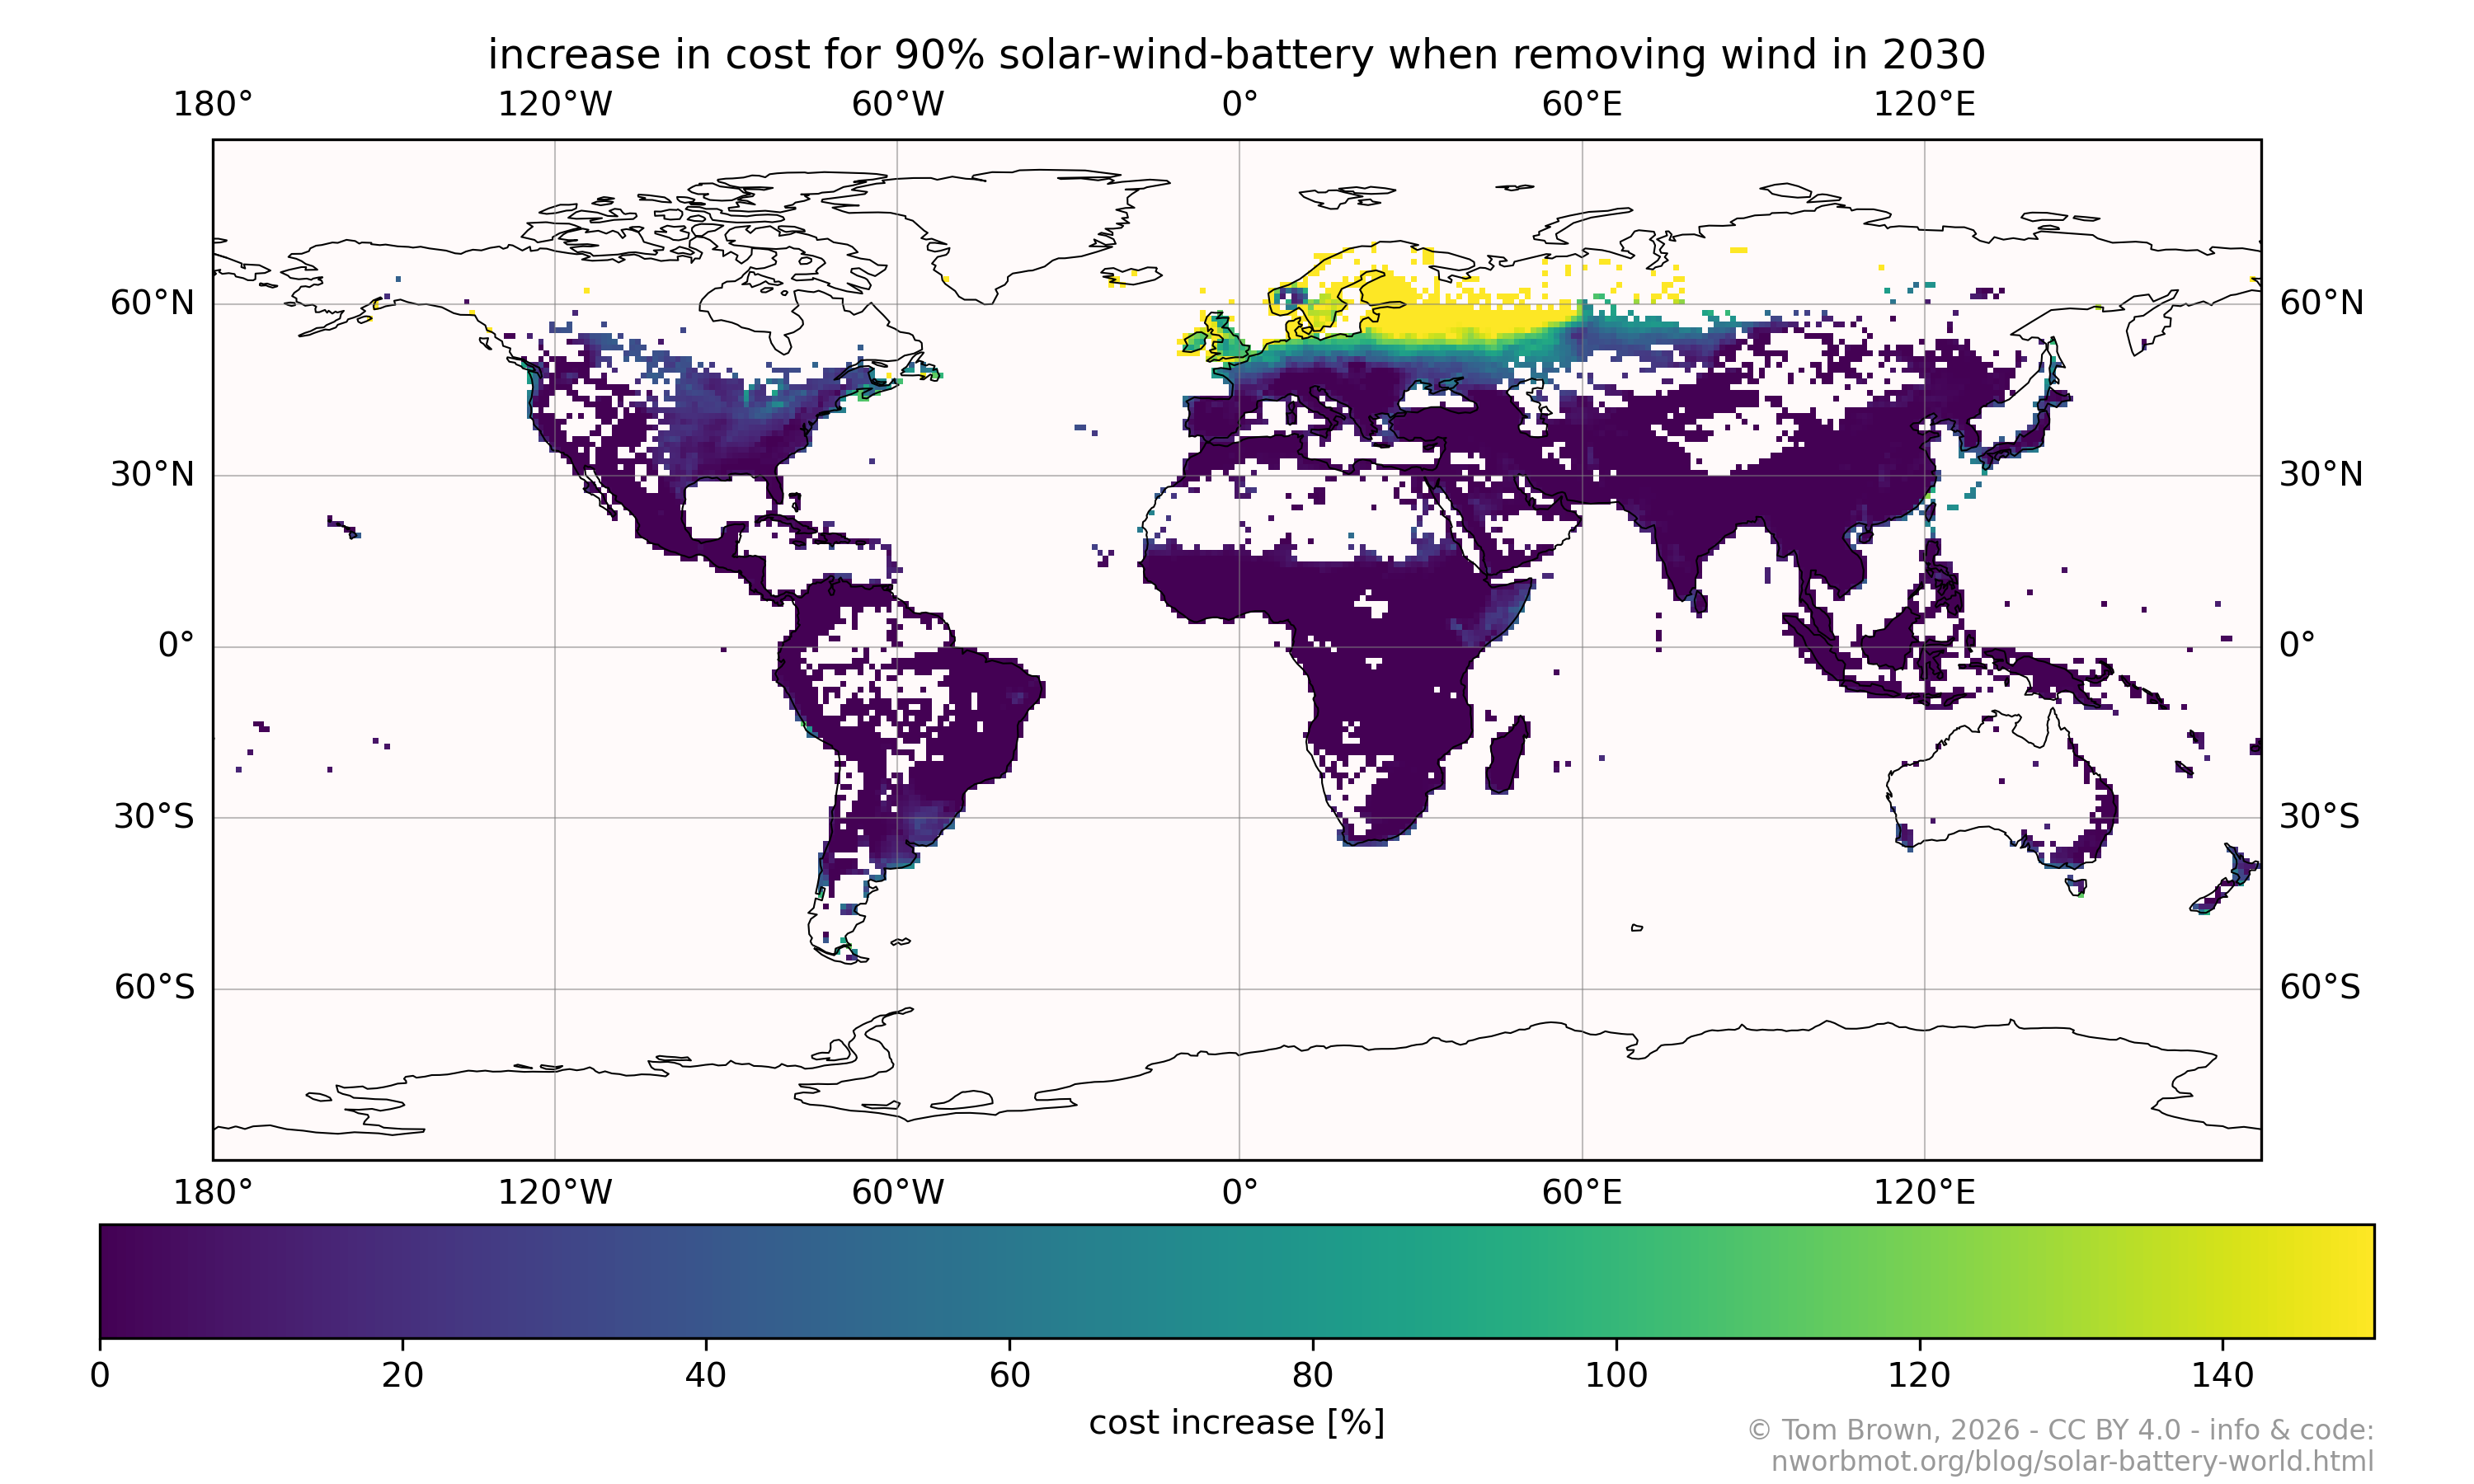
5.4. 2030 cost increase for solar-wind-battery when removing wind
5.5. Maps of other scenarios
5.5.1. 2030 solar-battery
5.5.2. 2050 solar-battery
5.5.3. 2030 solar-wind-battery

5.6. Stacked costs for other scenarios
5.6.1. 2050 90% solar-battery
5.6.2. 2030 90% solar-wind-battery
5.6.3. 2050 99% solar-wind-battery with cheaper batteries